

容器监控和日志
目录:
容器监控
Docker自带监控
docker container ls或ps
[root@test-03 ~]# docker container ls
CONTAINER ID        IMAGE                COMMAND             CREATED             STATUS              PORTS               NAMES
fe7d7018f9ca        busybox              "sh"                About an hour ago   Up About an hour                        testbox2
722910528ada        calico/node:v1.0.2   "start_runit"       About an hour ago   Up About an hour                        calico-node
top
[root@test-03 ~]# docker container top testbox2
UID                 PID                 PPID                C                   STIME               TTY                 TIME                CMD
root                1877                1861                0                   16:16               pts/0               00:00:00            sh
root                3918                1861                0                   16:29               ?                   00:00:00            ping 172.27.0.9
root                4161                1861                0                   16:31               ?                   00:00:00            ping 172.27.0.9
root                4394                1861                0                   16:32               ?                   00:00:00            ping testbox1
root                5366                1861                0                   16:39               ?                   00:00:00            ping testbox1
root                6122                1861                0                   16:45               ?                   00:00:00            ping testbox1
root                6366                1861                0                   16:46               ?                   00:00:00            ping 192.168.70.1
root                7379                1861                0                   16:55               ?                   00:00:00            ping 192.168.70.1
root                7462                1861                0                   16:55               ?                   00:00:00            ping testbox1
root                7491                1861                0                   16:55               ?                   00:00:00            ping testbox2
root                7527                1861                0                   16:55               ?                   00:00:00            ping testbox1
root                8308                1861                0                   17:00               ?                   00:00:00            ping testbox1
还可以跟上linux系统的ps命令的参数
[root@test-03 ~]# docker container top testbox2 -au
USER                PID                 %CPU                %MEM                VSZ                 RSS                 TTY                 STAT                START               TIME                COMMAND
root                1877                0.0                 0.0                 1240                256                 pts/0               Ss+                 16:16               0:00                sh
root                3918                0.0                 0.0                 1228                4                   ?                   Ss                  16:29               0:00                ping 172.27.0.9
root                4161                0.0                 0.0                 1228                4                   ?                   Ss                  16:31               0:00                ping 172.27.0.9
root                4394                0.0                 0.0                 1228                4                   ?                   Ss                  16:32               0:00                ping testbox1
root                5366                0.0                 0.0                 1228                4                   ?                   Ss                  16:39               0:00                ping testbox1
root                6122                0.0                 0.0                 1228                4                   ?                   Ss                  16:45               0:00                ping testbox1
root                6366                0.0                 0.0                 1228                4                   ?                   Ss                  16:46               0:00                ping 192.168.70.1
root                7379                0.0                 0.0                 1228                4                   ?                   Ss                  16:55               0:00                ping 192.168.70.1
root                7462                0.0                 0.0                 1228                4                   ?                   Ss                  16:55               0:00                ping testbox1
root                7491                0.0                 0.0                 1228                4                   ?                   Ss                  16:55               0:00                ping testbox2
root                7527                0.0                 0.0                 1228                4                   ?                   Ss                  16:55               0:00                ping testbox1
root                8308                0.0                 0.0                 1228                4                   ?                   Ss                  17:00               0:00                ping testbox1
stats
查看各个容器的资源使用情况
[root@test-03 ~]# docker container stats

CONTAINER ID        NAME                CPU %               MEM USAGE / LIMIT     MEM %               NET I/O             BLOCK I/O           PIDS
8699aa62b1b0        testbox3            0.00%               56KiB / 991.8MiB      0.01%               238B / 238B         0B / 0B             1
fe7d7018f9ca        testbox2            0.08%               564KiB / 991.8MiB     0.06%               8.32kB / 5.25MB     1.1MB / 0B          12
722910528ada        calico-node         0.63%               41.64MiB / 991.8MiB   4.20%               0B / 0B             133MB / 238kB       35
sysdig
docker container run -it --rm --name=sysdig --privileged=true \
          --volume=/var/run/docker.sock:/host/var/run/docker.sock \
          --volume=/dev:/host/dev \
          --volume=/proc:/host/proc:ro \
          --volume=/boot:/host/boot:ro \
          --volume=/lib/modules:/host/lib/modules:ro \
          --volume=/usr:/host/usr:ro \
          sysdig/sysdig
sysdig容器是以privileged方式运行,而且会读取操作系统/dev,/proc等数据
进入容器,执行csysdig命令,将以交互方式启动sysdig
$ docker exec -it sysdig bash
root@b8d33b2c9255:/# csysdig
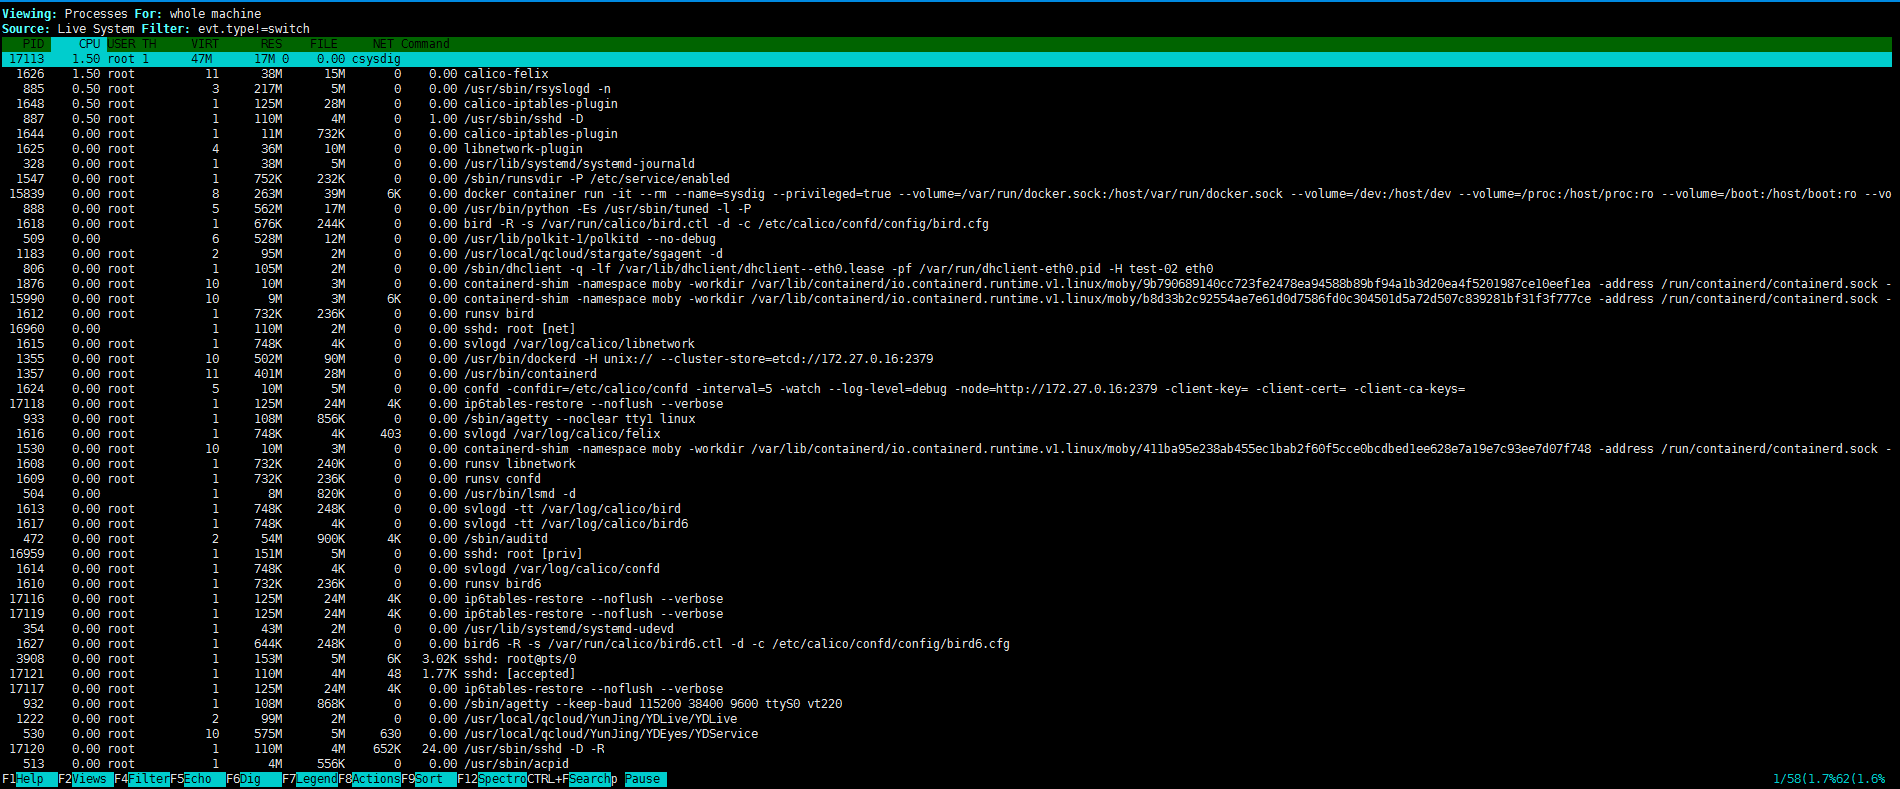
这是一个类似linux top命令的界面,但要强大太多。sysdig按不同的View来监控不同类型的资源,点击底部Views菜单(或者按 F2),显示View选择列表,然后双击Container进入容器监控页面
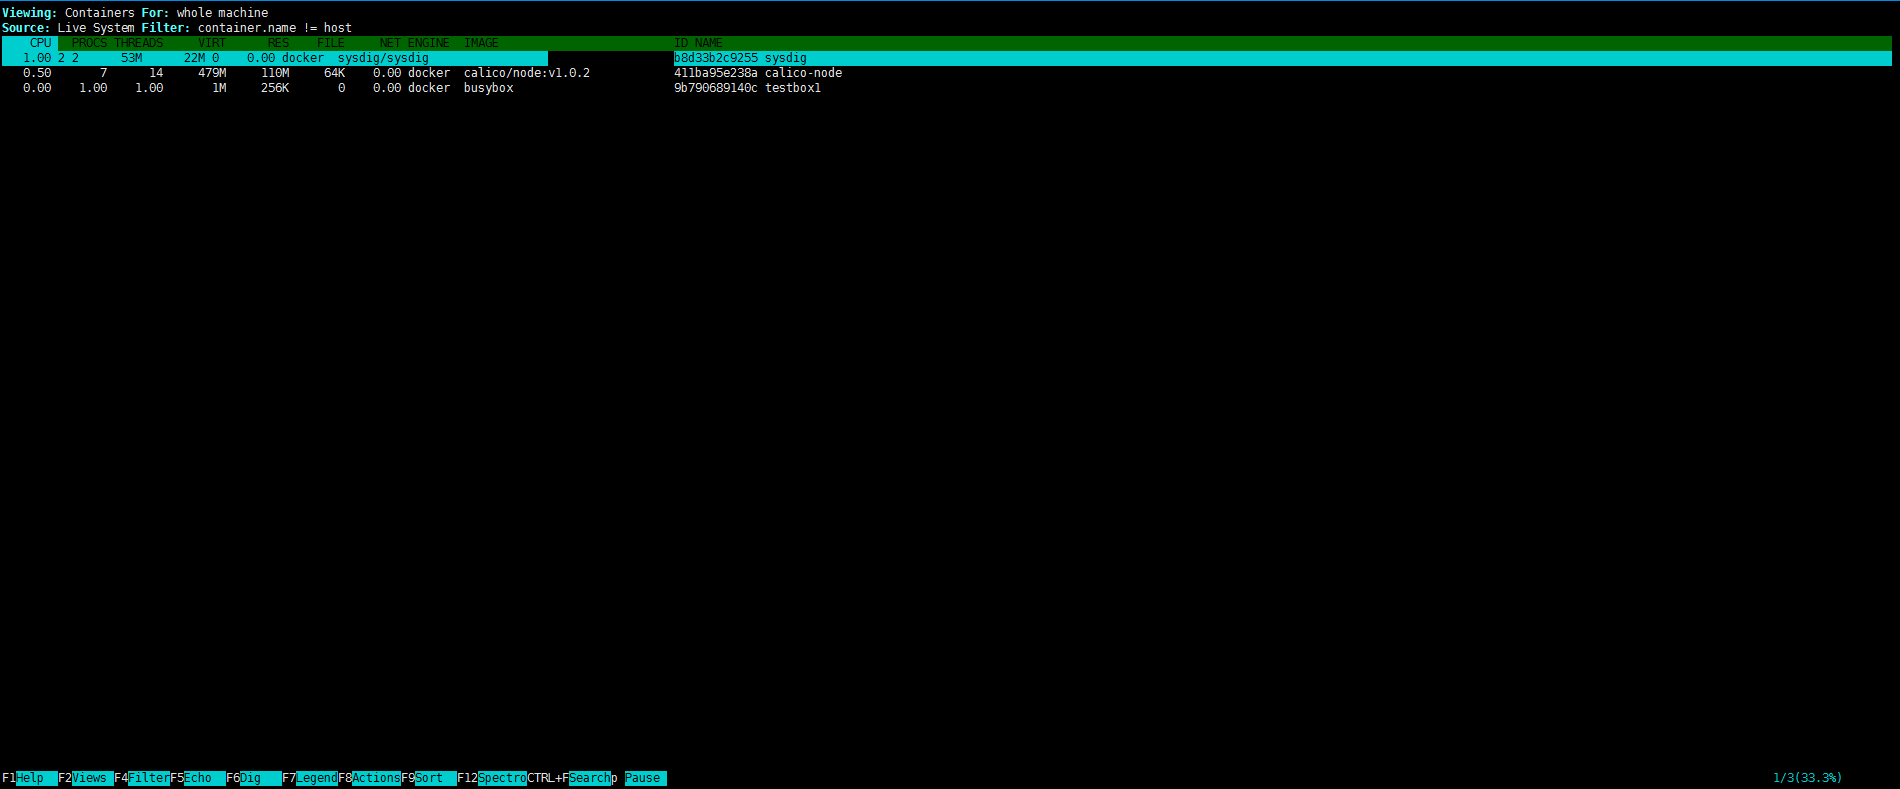
基本上能看到的都可双击或者单机,返回上一级,按退格键即可
sysdig的特点如下:
- 监控信息全,包括Linux操作系统和容器。
- 界面交互性强。
不过 sysdig 显示的是实时数据,看不到变化和趋势。而且是命令行操作方式,需要ssh到Host上执行,会带来一些不便。
Weave Scope
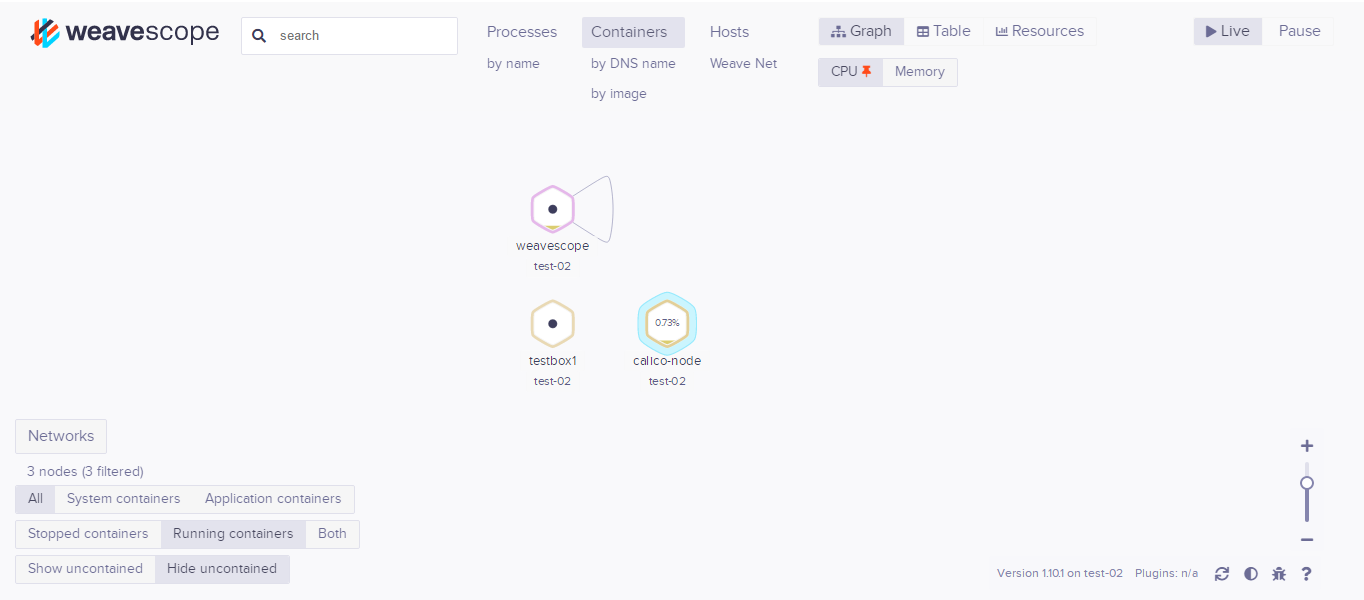
Weave Scope的最大特点是会自动生成一张Docker容器地图,让我们能够直观地理解、监控和控制容器。
安装Weave
curl -L git.io/scope -o /usr/local/bin/scope
chmod a+x /usr/local/bin/scope
scope launch
scope launch将以容器方式启动 Weave Scope
[root@test-02 ~]# scope launch
040c4d41aff25701cdee99495cf41ca70714be292a2c7412c08784a18ea3da5c
Scope probe started
Weave Scope is listening at the following URL(s):
  * http://172.27.0.9:4040/
[root@test-02 ~]# ss -nlpt | grep 4040
LISTEN     0      128         :::4040                    :::*                   users:(("scope",pid=22680,fd=5))
CONTAINER ID        IMAGE                     COMMAND                  CREATED             STATUS              PORTS               NAMES
040c4d41aff2        weaveworks/scope:1.10.1   "/home/weave/entrypo…"   25 minutes ago      Up 25 minutes                           weavescope
访问URL就可以直接使用http://172.27.0.9:4040/
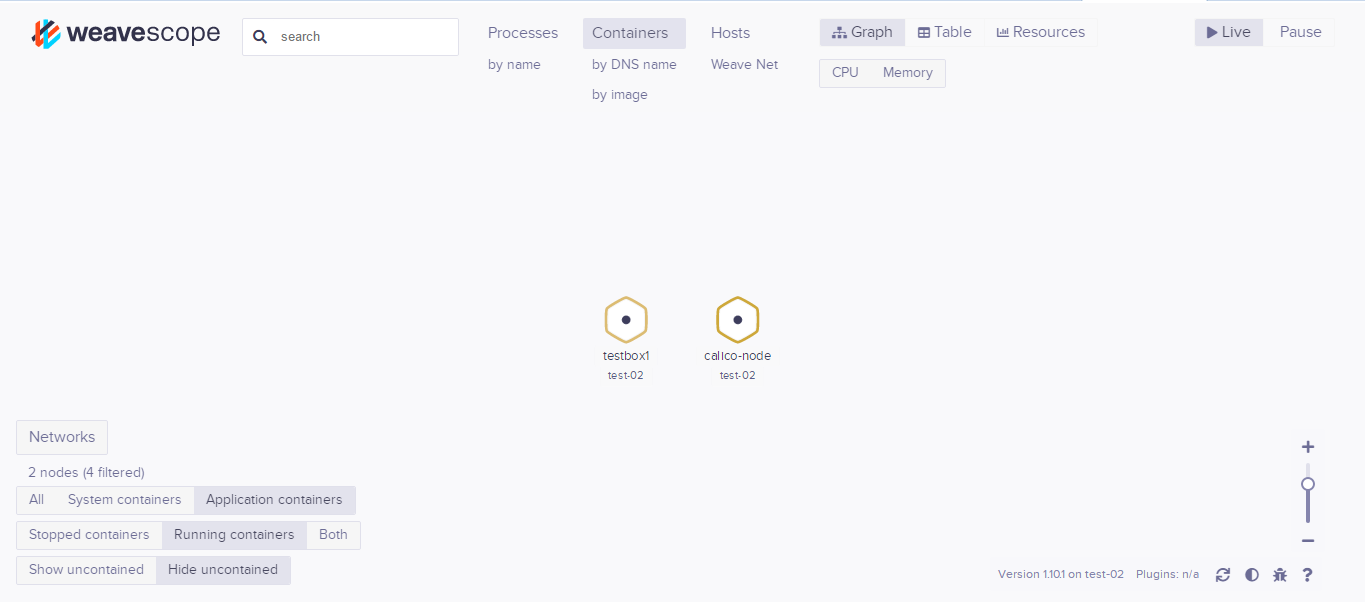
容器监控
Weave Scope显示了主机运行的容器,不过没有weave相关的容器,可以点一下左下角的ALL显示所有的容器
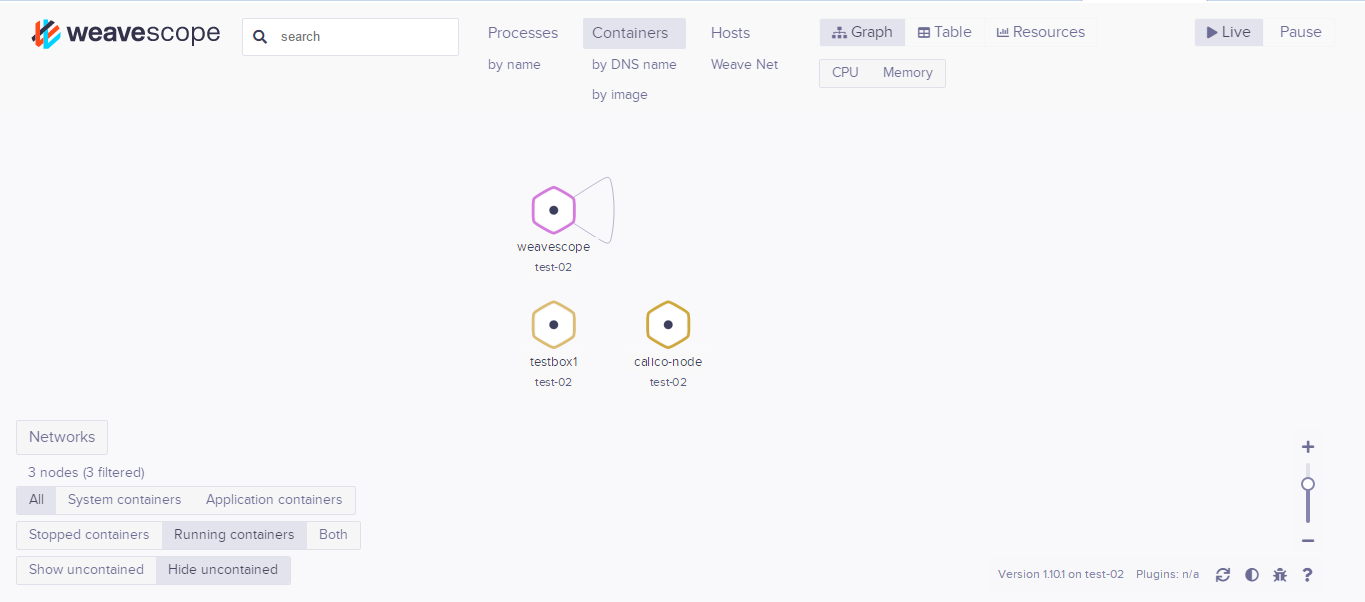
Weave Scope界面是一个可交互的地图,点击CPU,可以在容器中显示CPU的使用情况,以高低水位方式显示,鼠标放上去会有具体的显示
点击可以看到详细信息
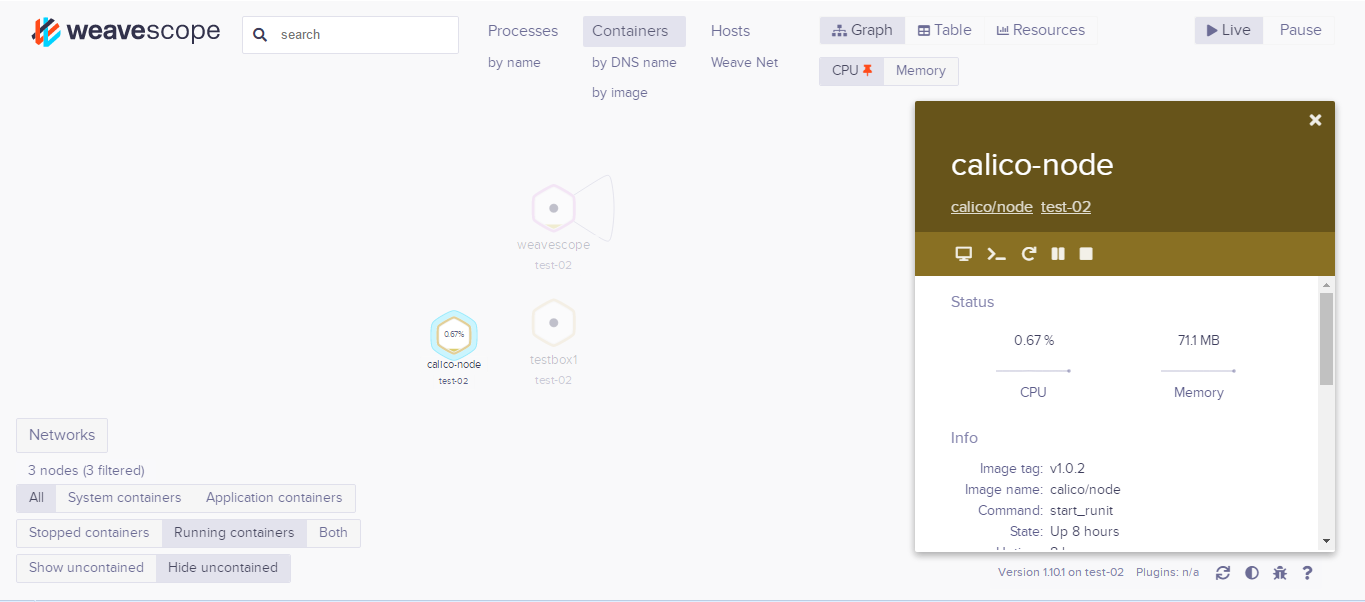
- 一排操作 竟然还能执行,重启等
- Status CPU和内存实时使用情况以及历史曲线
- INFO 容器image、启动命令、状态、网络等信息
- PROCESSES 容器中运行的进程
- ENVIRONMENT VARIABLES 环境变量
DOCKER LABELS容器启动命令- IMAGE 镜像详细信息
点击host可以切换到主机
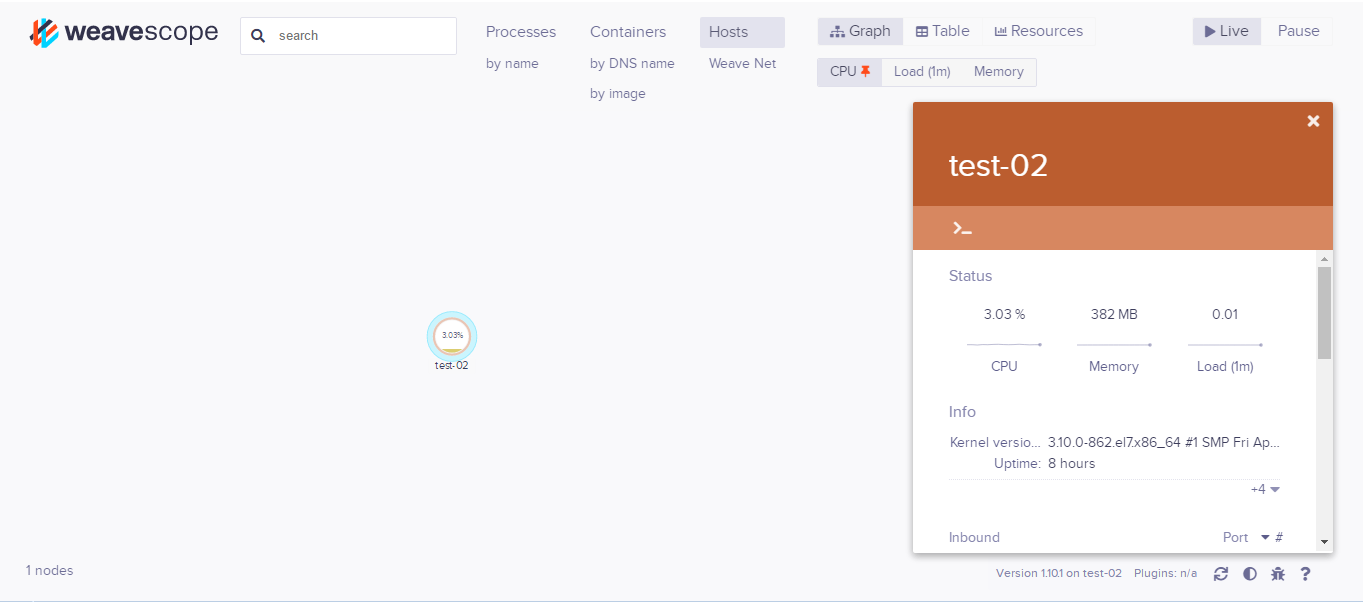
host当前的资源使用情况和历史曲线一览无余。除此之外也能很方便地查看host上运行的进程和容器列表,点击容器名字还可以打开此容器的信息页面,还提供了直接打开主机shell =窗口,由于这些的存在,一定不要将其暴露在外网
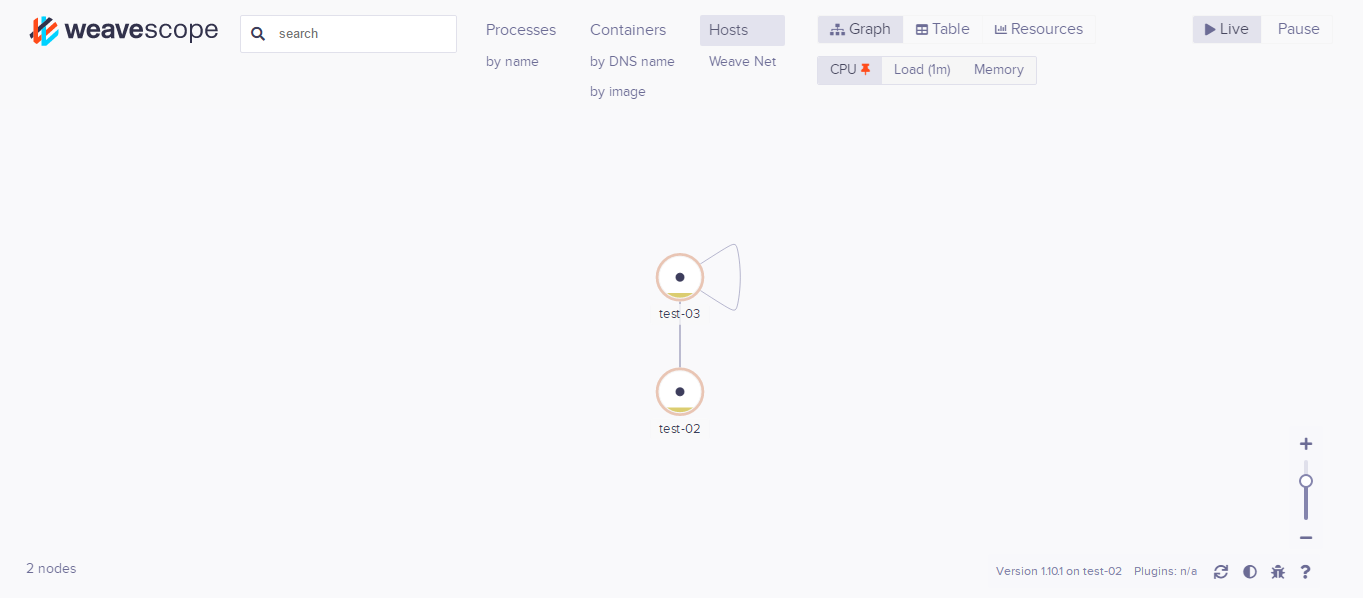
多主机监控
示例两台主机172.27.0.17和172.27.0.9
在两台主机同时执行以下命令
scope launch 172.27.0.17 172.27.0.9
这样每台机器的4040端口都可以看到两台机器和其上容器
还可以通过Search进行搜索
cAdvisor
cAdvisor由google开发
docker run \
  --volume=/:/rootfs:ro \
  --volume=/var/run:/var/run:rw \
  --volume=/sys:/sys:ro \
  --volume=/var/lib/docker/:/var/lib/docker:ro \
  --publish=8080:8080 \
  --detach=true \
  --name=cadvisor \
  google/cadvisor:latest
cAdvisor可以展示Host和容器两个层次的监控数据,并且可以展示历史变化数据。
由于cAdvisor提供的操作界面略显简陋,而且需要在不同页面之间跳转,并且只能监控一个host。但cAdvisor的一个亮点是它可以将监控到的数据导出给第三方工具,由这些工具进一步加工处理。
所以cAdvisor被定位为一个监控数据收集器,收集和导出数据是它的强项,而非展示数据。
Prometheus
Prometheus架构
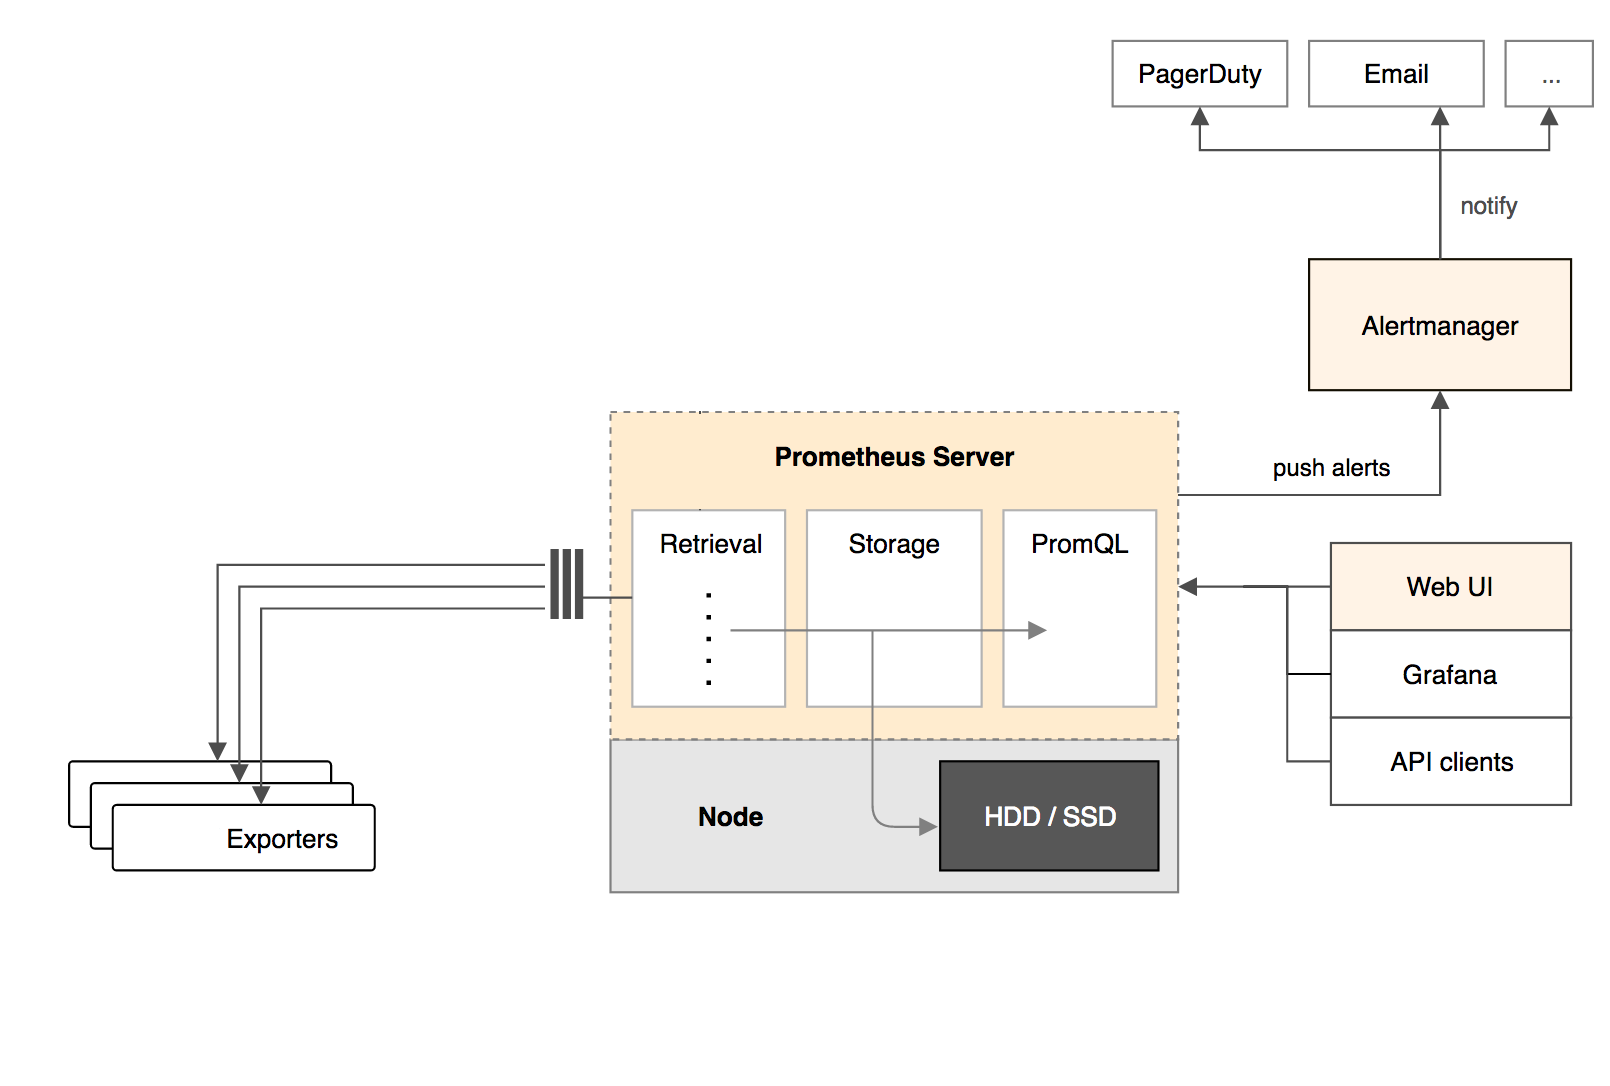
- Prometheus Server 负责从Exporter拉取和存储监控数据,并提供一套灵活的查询语言(PromQL)供用户使用
- Exporter 负责收集Host和Container的性能数据,并通过HTTP接口
Prometheus Server - 可视化组件 Grafana能够与Prometheus无缝集成,提供完美的数据展示能力。
- Alertmanager 可以用于自定义报警规则,一旦Alermanager收到告警,会通过预定义的方式发出告警通知。支持的方式包括Email、PagerDuty、Webhook等
Prometheus多维度数据
time |
container_memory_usage_bytes |
container_name |
image |
env |
|---|---|---|---|---|
| 00:01:00 | 37738736 | webapp1 | why/webapp:1.2 |
prod |
| 00:02:00 | 37734302 | webapp1 | why/webapp:1.2 |
prod |
| 00:03:00 | 37810086 | webapp1 | why/webapp:1.3 |
prod |
container_name,image和env就是维度了,可以根据维度来满足业务需求,例如
- 计算webapp1的平均内存使用情况
avg(container_memory_usage_bytes{container_name="webapp1"}) - 计算运行
mycom/webapp:1.2镜像的所有容器内存使用总量:sum(container_memory_usage_bytes{image="mycom/webapp:1.3"}) - 统计不同运行环境中webapp容器内存使用总量:
sum(container_memory_usage_bytes{container_name=~"webapp"}) by (env)
Prometheus部署
Exporter
Node Exporter,负责收集host硬件和操作系统数据,它将以容器方式运行在所有host上- cAdvisor,负责收集容器数据,它将以容器方式运行在所有host上。
安装Node Exporter
docker run -d -p 9100:9100 \
-v "/proc:/host/proc" \
-v "/sys:/host/sys" \
-v "/:/rootfs" \
--net=host \
prom/node-exporter \
--path.procfs /host/proc \
--path.sysfs /host/sys \
--collector.filesystem.ignored-mount-points "^/(sys|proc|dev|host|etc)($|/)"
可以通过curl 127.0.0.1:9100/metrics检测一下采集到的数据
安装cAdvisor
docker run \
--volume=/:/rootfs:ro \
--volume=/var/run:/var/run:rw \
--volume=/sys:/sys:ro \
--volume=/var/lib/docker/:/var/lib/docker:ro \
--publish=8080:8080 \
--detach=true \
--name=cadvisor \
--net=host \
google/cadvisor:latest
可以通过curl 127.0.0.1:8080/metrics检测一下采集到的数据
Prometheus Server
以容器方式运行
这边配置的/root/prometheus.yml
global:
  scrape_interval: 15s
  evaluation_interval: 15s
  external_labels:
    monitor: 'codelab-monitor'
rule_files:
scrape_configs:
  - job_name: 'prometheus'
    static_configs:
      - targets: ['172.27.0.9:9090', '172.27.0.9:9100', '172.27.0.9:8080', '172.27.0.17:9100', '172.27.0.17:8080']
启动容器
docker run -d -p 9090:9090 \
-v /root/prometheus.yml:/etc/prometheus/prometheus.yml \
--name prometheus \
--net=host \
prom/prometheus
可以通过curl 127.0.0.1:9090/metrics检测一下采集到的数据
通过172.27.0.9:9090/graph可以进行web端的访问了
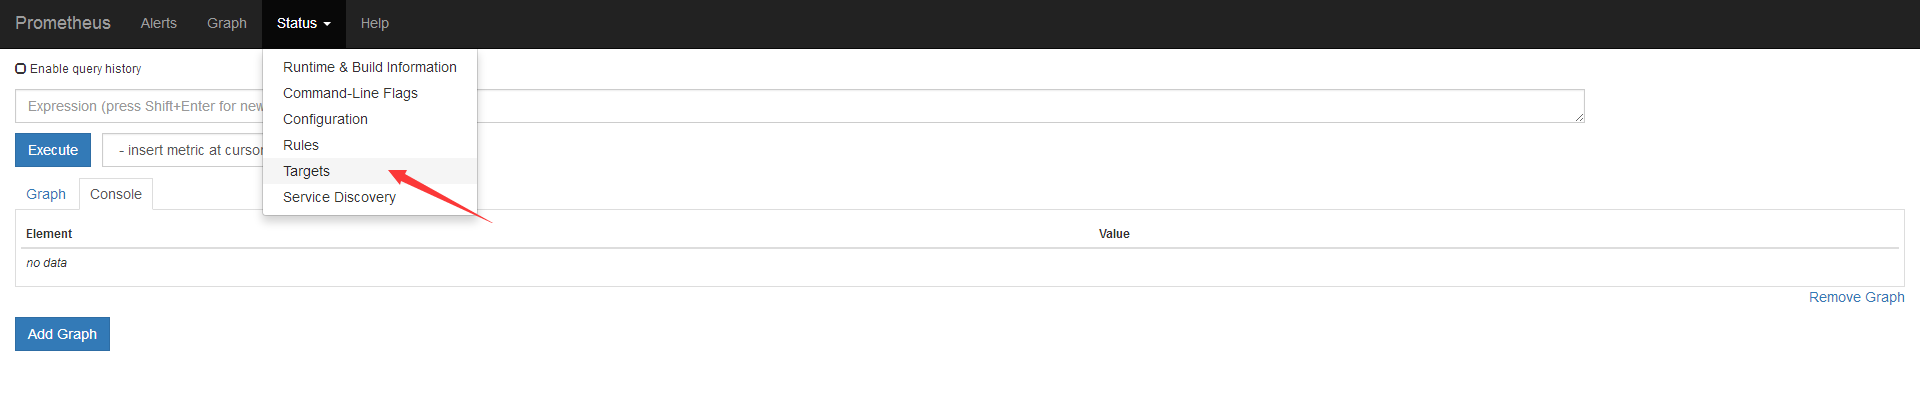
点击一下Status的Targets
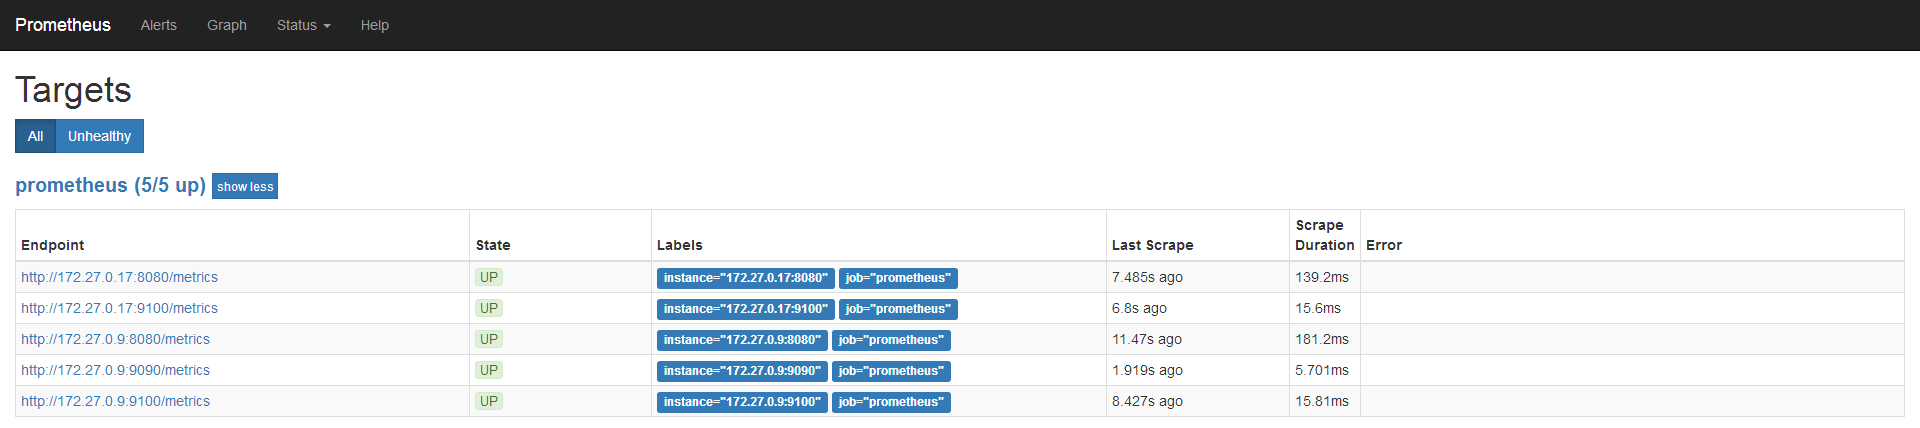
所有Target的State都是UP,说明Prometheus Server能够正常获取监控数据
Grafana
以容器方式运行
docker run -d -i -p 3000:3000 \
-e "GF_SERVER_ROOT_URL=http://grafana.server.name" \
-e "GF_SECURITY_ADMIN_PASSWORD=secret" \
--net=host \
grafana/grafana
通过172.27.0.9:3000可以访问前端资源

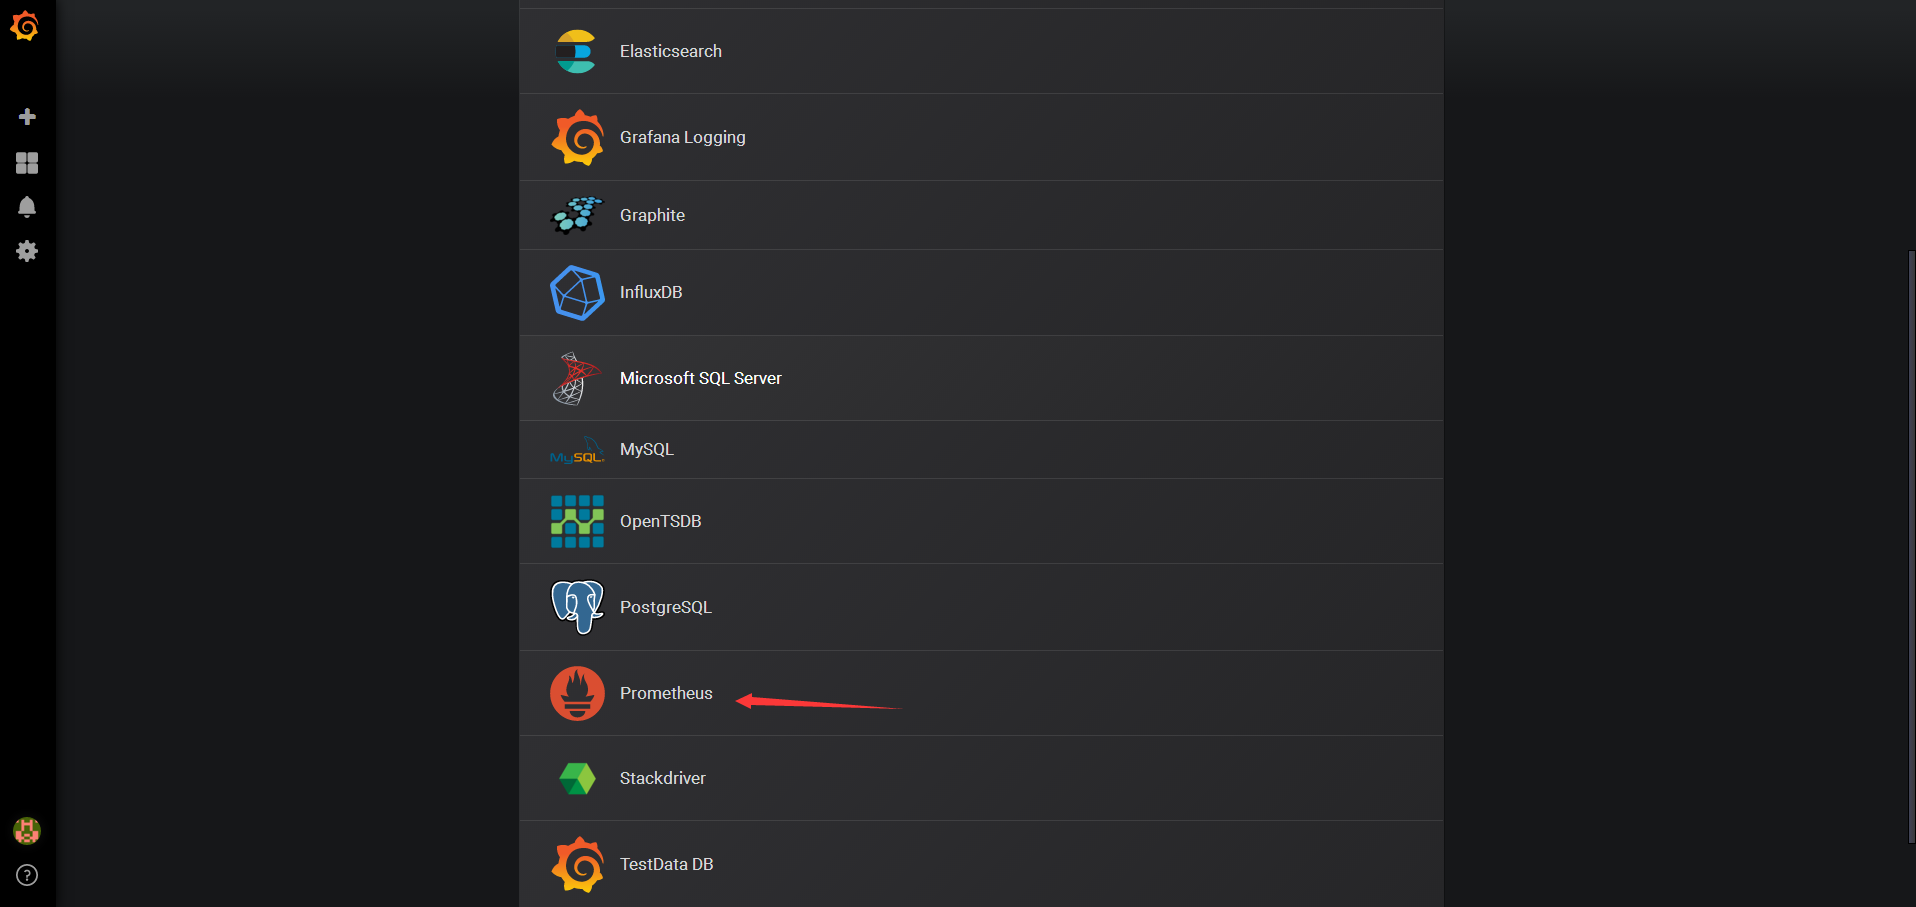
添加数据源
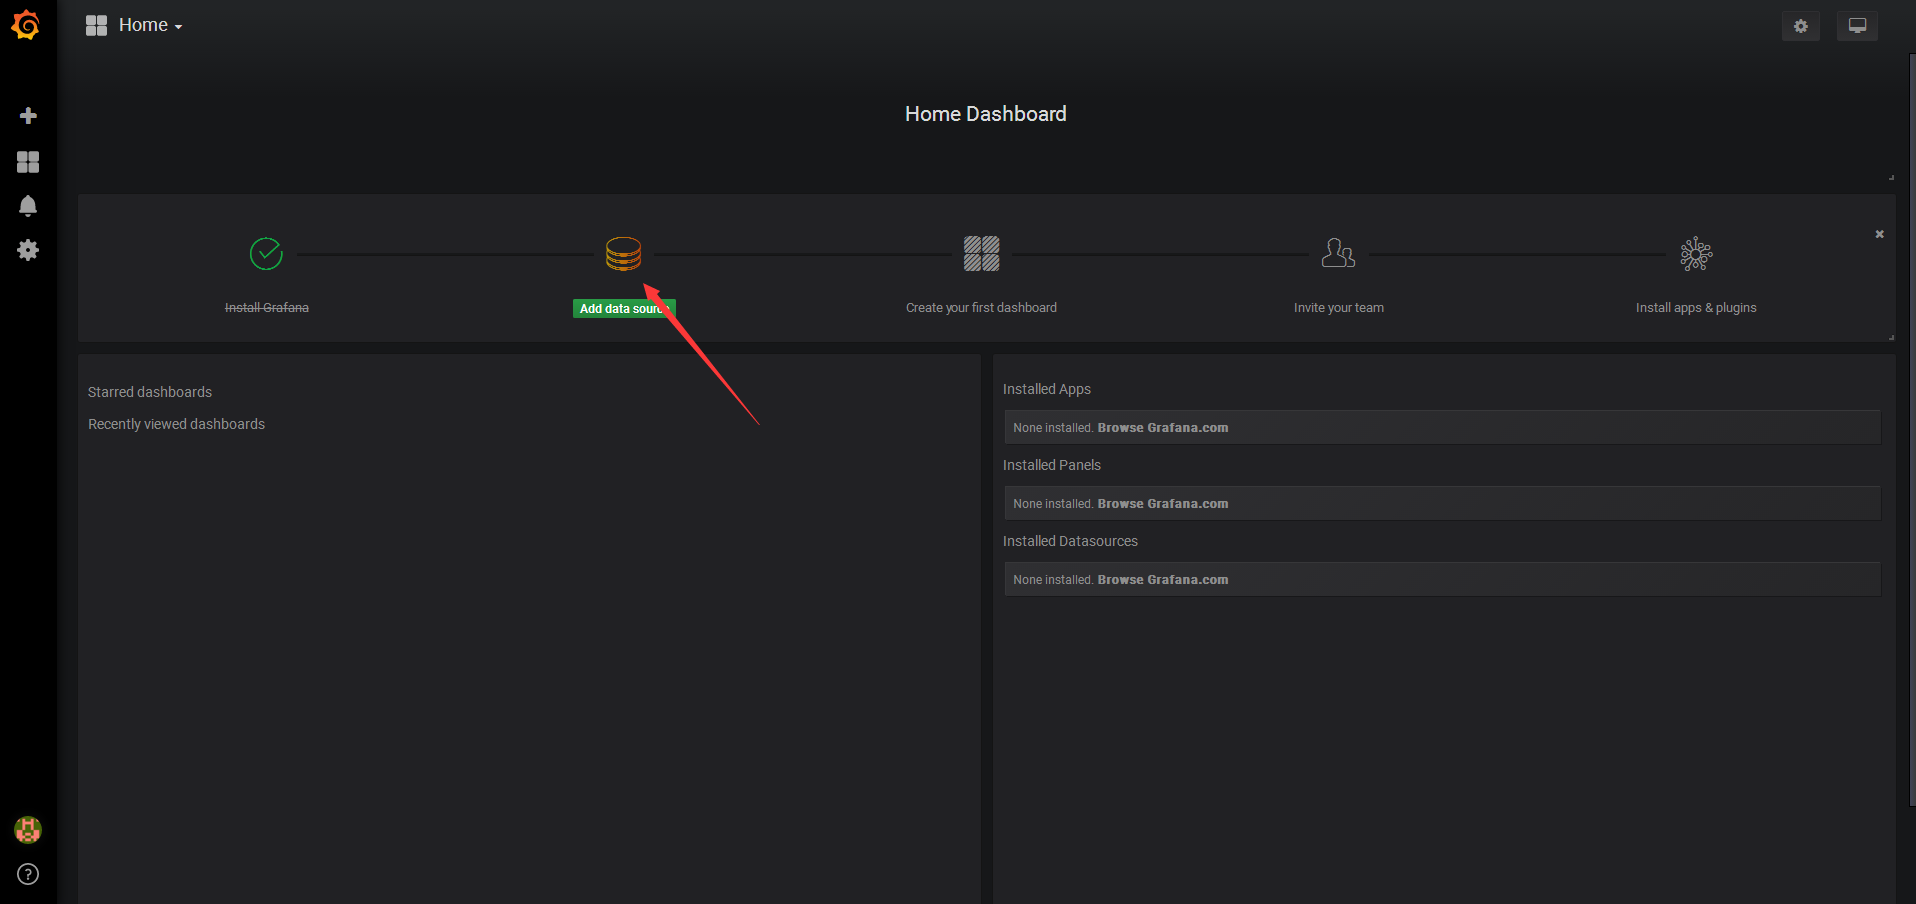
选择Prometheus
配置Prometheus
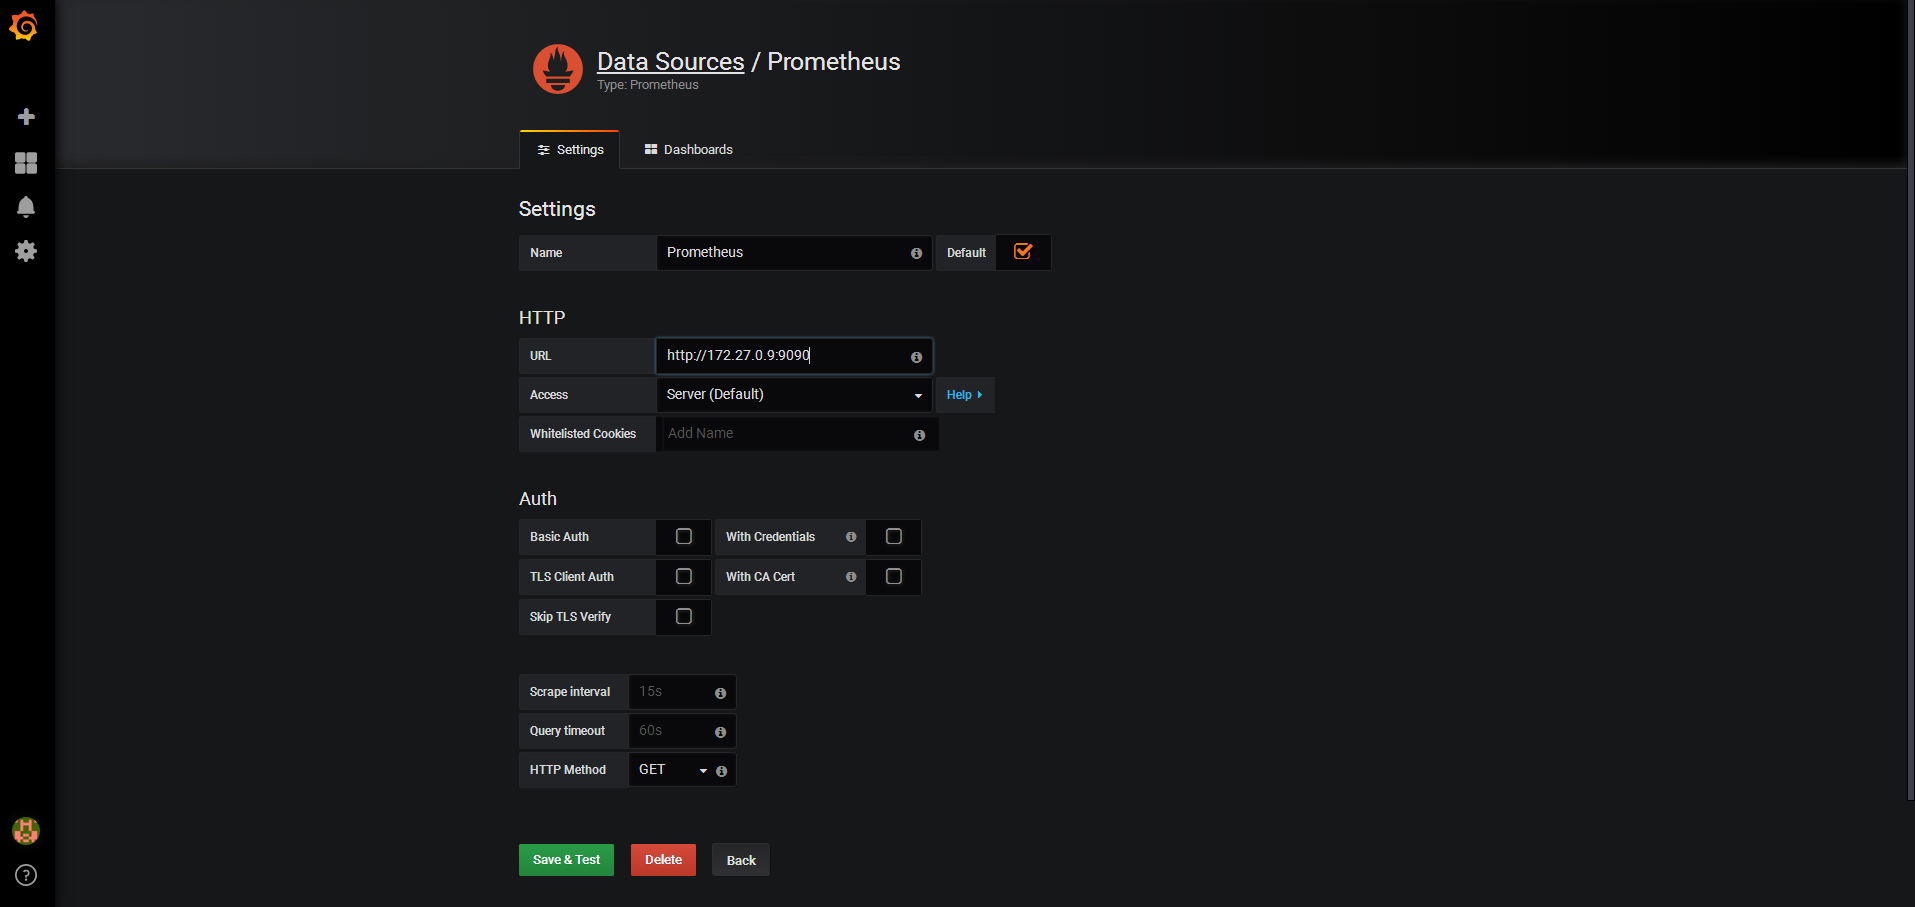
然后save&test即可
对于容器的grafana模板可以参考官方
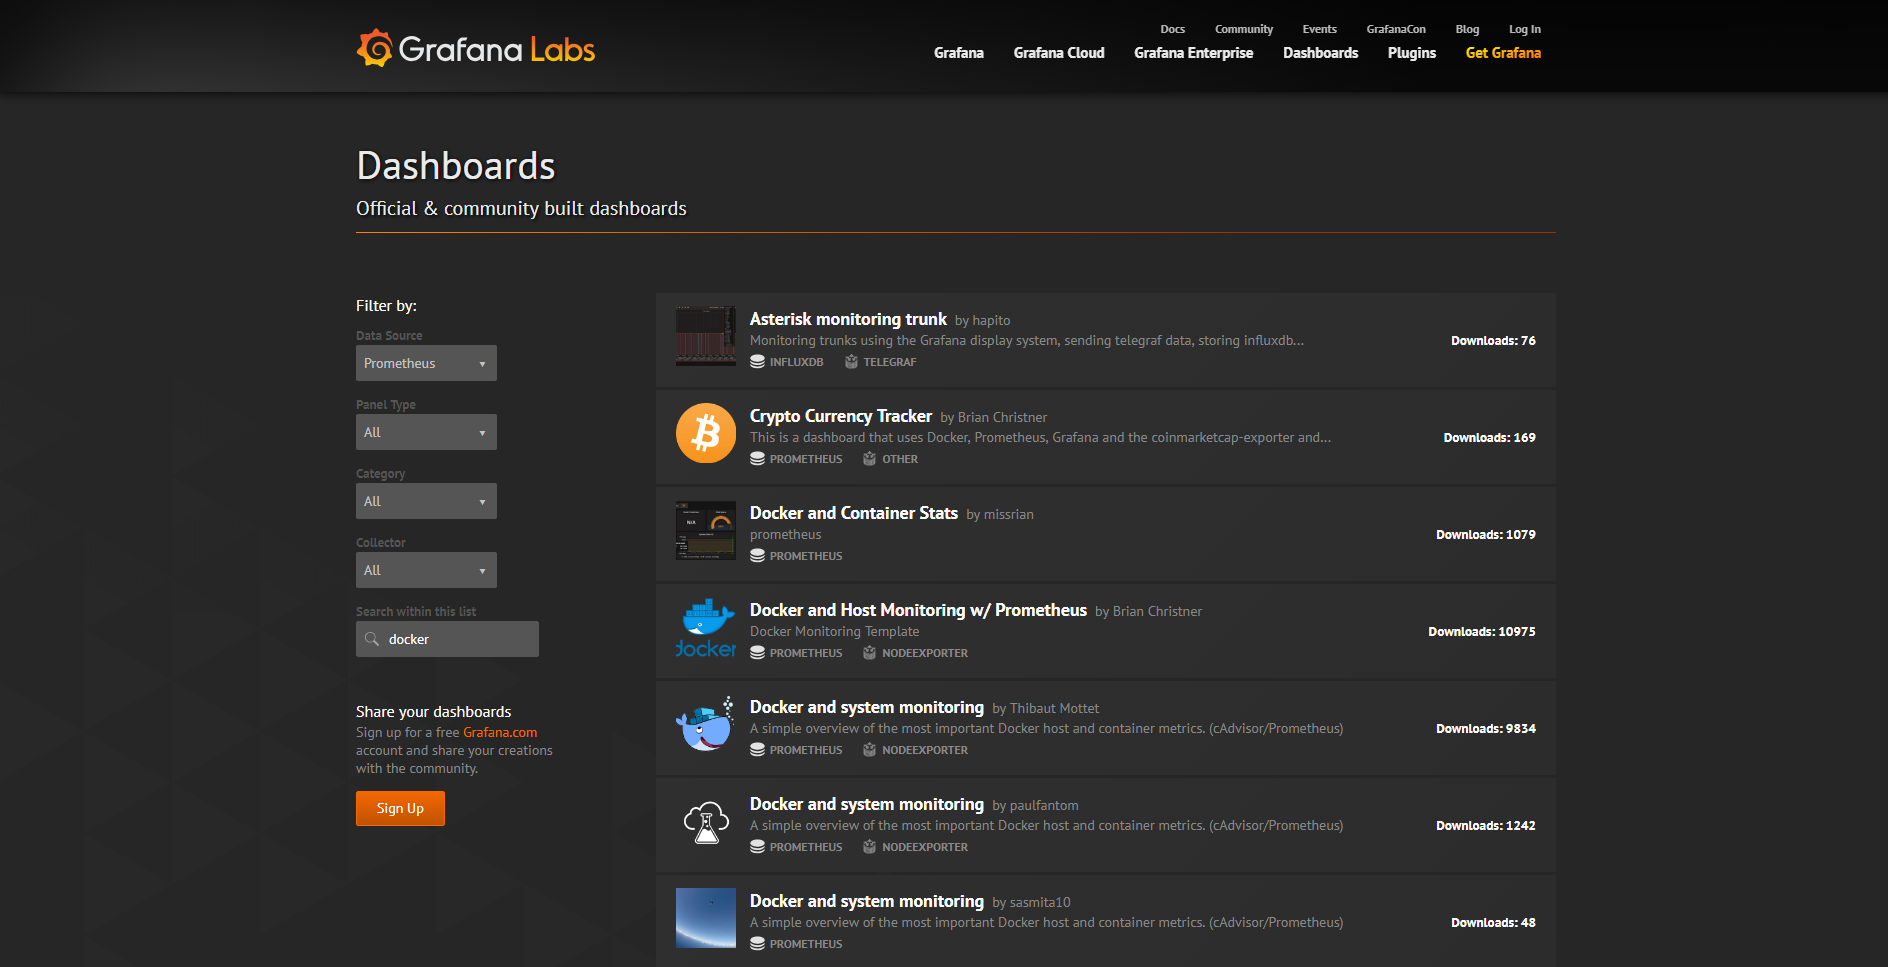
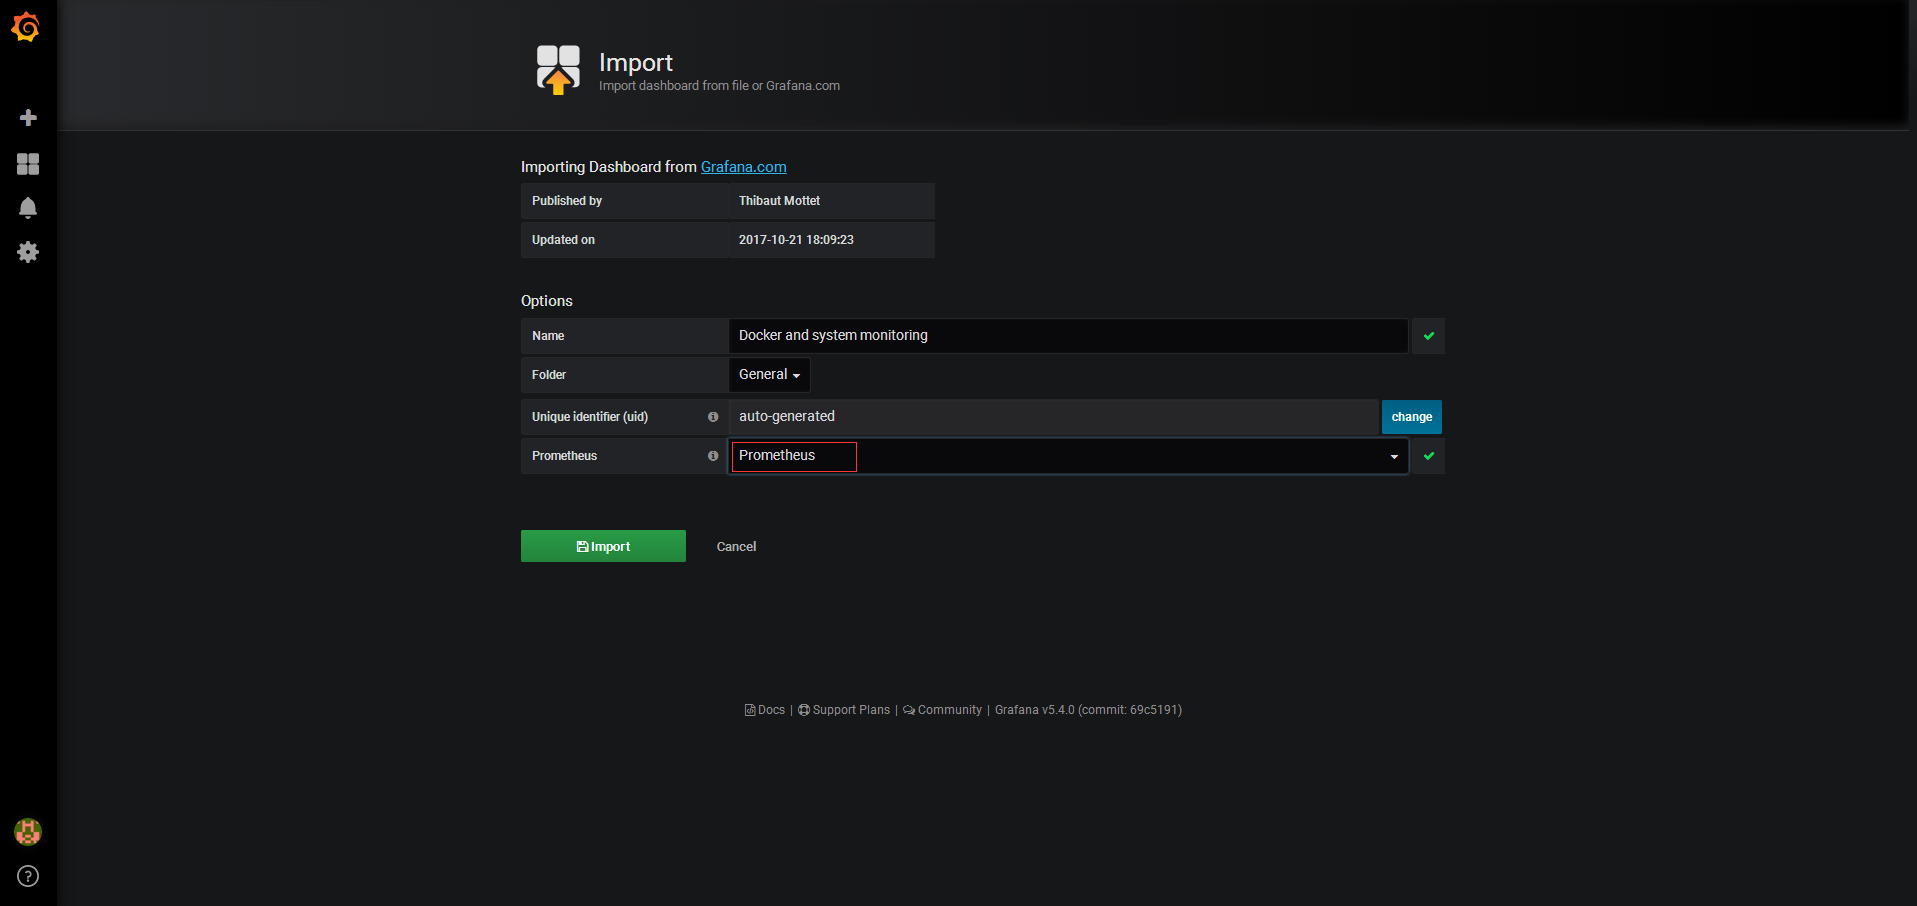
可以选择一个模板,示例Docker and Host Monitoring
选择Import
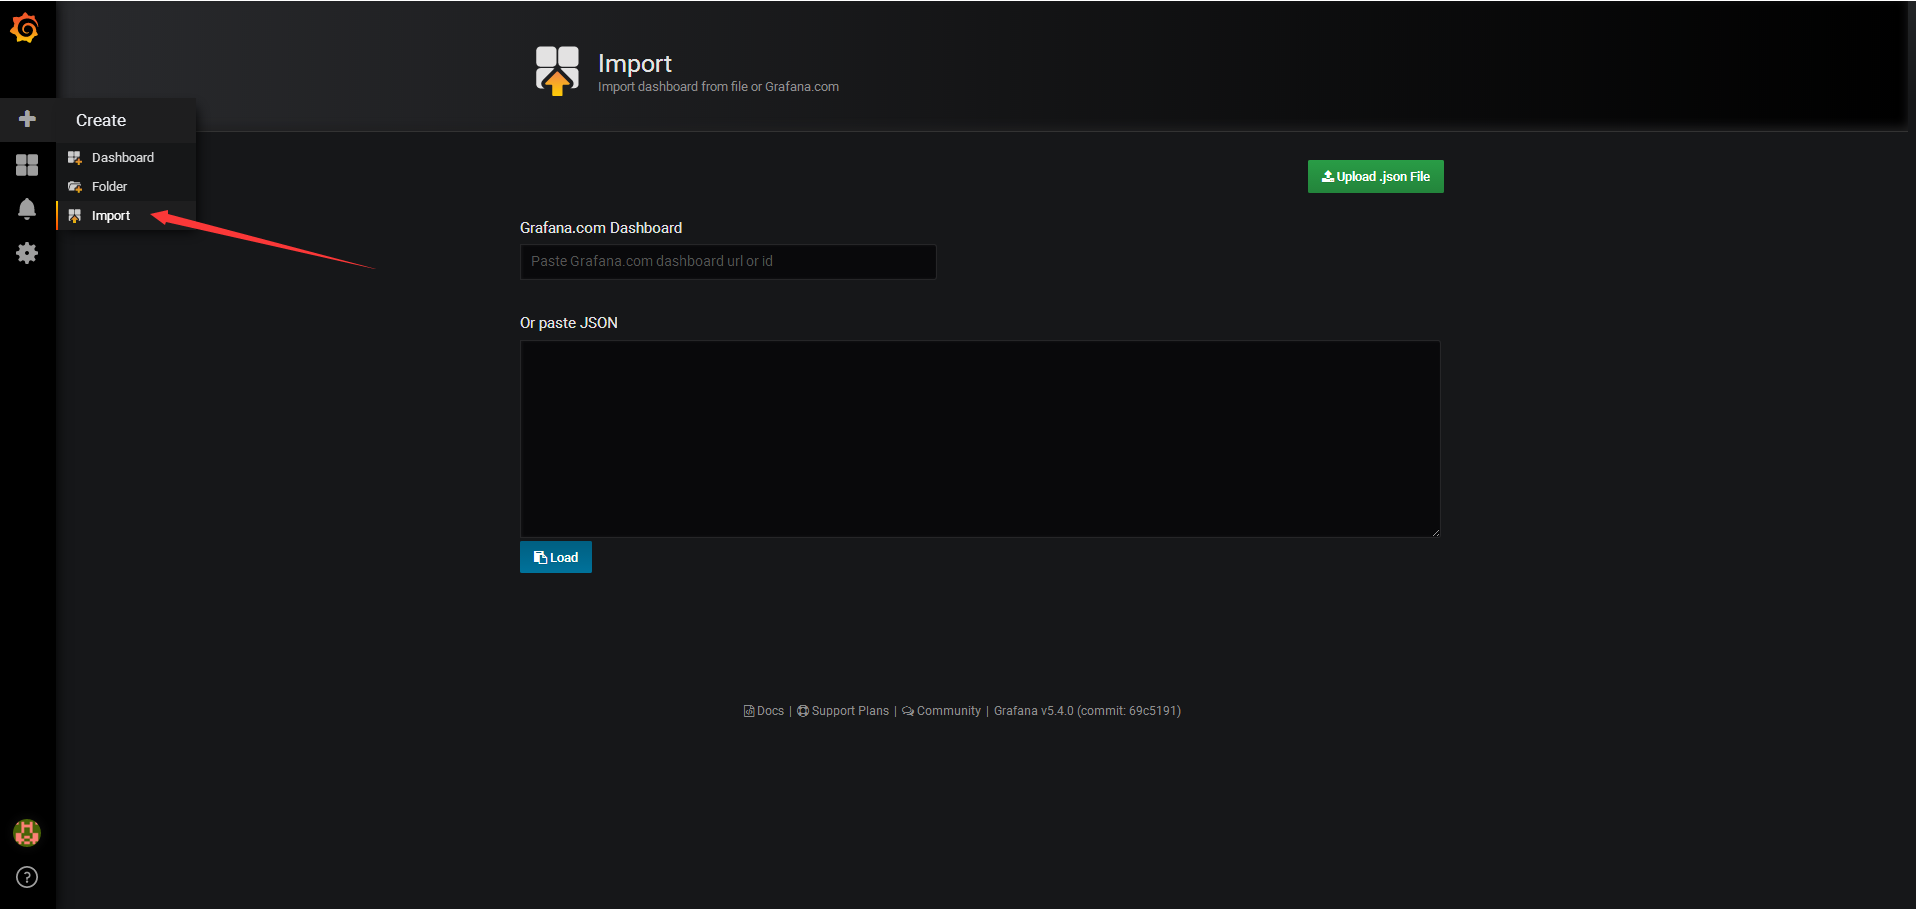
这里填入URL即可grafana.com/dashboards/893,选择一下Prometheus
监控选型
一般通过五方面进行比较
- 部署容易度
- 数据详细度
- 多主机监控
- 告警功能
- 监控非容器资源
- Docker ps/top/stats最适合快速了解容器运行状态,从而判断是否需要进一步分析和排查。
- Sysdig 提供了的丰富的分析和挖掘功能,是Troubleshooting的神器
- cAdvisor一般不会单独使用,通常作为其他监控工具的数据收集器,比如Prometheus
- Weave Scope流畅简洁的操控界面是其最大亮点,而且支持直接在Web界面上执行命令
- Prometheus的数据模型和架构决定了它几乎具有无限的可能性。
Prometheus和Weave Scope都是优秀的容器监控方案。除此之外,Prometheus还可以监控其他应用和系统,更为综合和全面。
容器日志
容器短暂并且生命周期不固定,对于需要debug的时候容器不存在
Docker logs
运行的容器的时候,Docker会将日志发送到容器的标准输出设备和标准输入设备
如果不指定-d参数后台运行,会将标准输出打印到前台
[root@test-02 ~]# docker run -p 80:80 httpd
AH00558: httpd: Could not reliably determine the server's fully qualified domain name, using 172.17.0.2. Set the 'ServerName' directive globally to suppress this message
AH00558: httpd: Could not reliably determine the server's fully qualified domain name, using 172.17.0.2. Set the 'ServerName' directive globally to suppress this message
[Tue Dec 04 11:53:04.054813 2018] [mpm_event:notice] [pid 1:tid 140054054167744] AH00489: Apache/2.4.37 (Unix) configured -- resuming normal operations
[Tue Dec 04 11:53:04.055976 2018] [core:notice] [pid 1:tid 140054054167744] AH00094: Command line: 'httpd -D FOREGROUND'
当指定了-d参数
[root@test-02 ~]# docker run -d -p 80:80 httpd
f1b87d2edd884600676582c875b72527f5297b368557024410dd0e108755cd26
可以直接使用docker logs命令进行查看,-f参数可以打印新产生的日志
[root@test-02 ~]# docker logs  -f f1b87d2edd884600676582c875b72527f5297b368557024410dd0e108755cd26
AH00558: httpd: Could not reliably determine the server's fully qualified domain name, using 172.17.0.2. Set the 'ServerName' directive globally to suppress this message
AH00558: httpd: Could not reliably determine the server's fully qualified domain name, using 172.17.0.2. Set the 'ServerName' directive globally to suppress this message
[Tue Dec 04 11:57:30.687347 2018] [mpm_event:notice] [pid 1:tid 140477339808960] AH00489: Apache/2.4.37 (Unix) configured -- resuming normal operations
[Tue Dec 04 11:57:30.687488 2018] [core:notice] [pid 1:tid 140477339808960] AH00094: Command line: 'httpd -D FOREGROUND'
Docker的日志机制
Docker的默认logging driver是json-file
[root@test-02 ~]# docker info |grep 'Logging Driver'
Logging Driver: json-file
如果启动容器的时候没有指定,默认就是json-file,json-file会将容器的日志存放在唉json文件中,Docker负责格式化输出,路径为/var/lib/docker/containers/<contariner ID>/<contariner ID>-json.log
[root@test-02 ~]# cat /var/lib/docker/containers/f1b87d2edd884600676582c875b72527f5297b368557024410dd0e108755cd26/f1b87d2edd884600676582c875b72527f5297b368557024410dd0e108755cd26-json.log
{"log":"AH00558: httpd: Could not reliably determine the server's fully qualified domain name, using 172.17.0.2. Set the 'ServerName' directive globally to suppress this message\n","stream":"stderr","time":"2018-12-04T11:57:30.683956625Z"}
{"log":"AH00558: httpd: Could not reliably determine the server's fully qualified domain name, using 172.17.0.2. Set the 'ServerName' directive globally to suppress this message\n","stream":"stderr","time":"2018-12-04T11:57:30.684015364Z"}
{"log":"[Tue Dec 04 11:57:30.687347 2018] [mpm_event:notice] [pid 1:tid 140477339808960] AH00489: Apache/2.4.37 (Unix) configured -- resuming normal operations\n","stream":"stderr","time":"2018-12-04T11:57:30.689881536Z"}
{"log":"[Tue Dec 04 11:57:30.687488 2018] [core:notice] [pid 1:tid 140477339808960] AH00094: Command line: 'httpd -D FOREGROUND'\n","stream":"stderr","time":"2018-12-04T11:57:30.689902059Z"}
其他的类似
- none disable容器日志功能
- syslog和journald Linux上的两种日志管理服务
- awslogs、splunk和gcplogs 第三方日志托管服务
- gelf和fluentd 开源的日志管理方案
更多的日志机制参考supported-logging-drivers
- 容器启动时可以通过
--log-driver指定使用的logging driver - 设置Docker默认的
logging driver,需要修改Docker daemon的启动脚本,指定--log-driver参数,示例ExecStart=/usr/bin/dockerd -H fd:// --log-driver=syslog --log-opt
ELK日志解决方案
Logstash负责从各个Docker容器中提取日志,Logstash将日志转发到Elasticsearch进行索引和保存,Kibana分析和可视化数据
docker run -p 5601:5601 -p 9200:9200 -p 5044:5044 -it --name elk sebp/elk
- 访问对应的5601端口可以打开kibana,http://172.27.0.9:5601/
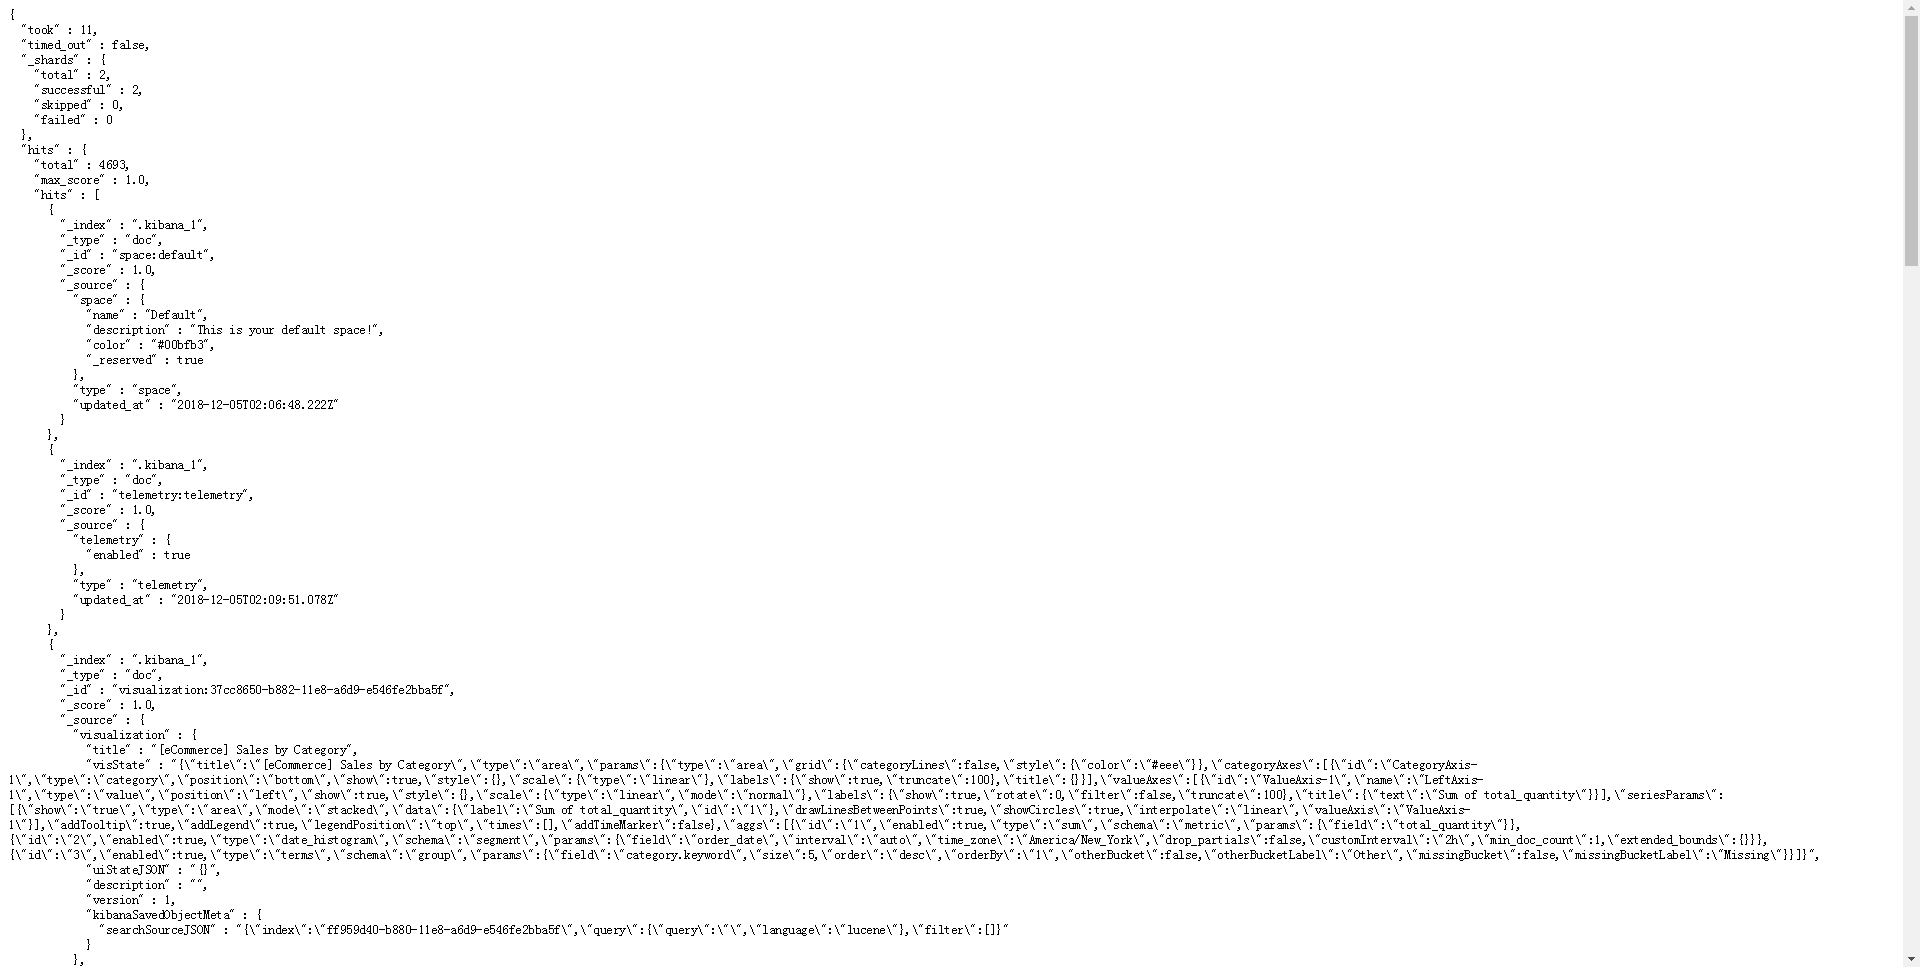
- 访问对应的9200端口可以打开elasticea,http://172.27.0.9:9200/_search?pretty

安装Filebeat
curl -L -O https://artifacts.elastic.co/downloads/beats/filebeat/filebeat-6.5.1-x86_64.rpm
sudo rpm -vi filebeat-6.5.1-x86_64.rpm
https://www.elastic.co/guide/en/beats/filebeat/current/filebeat-installation.html
修改配置文件/etc/filebeat/filebeat.yml
- type: log
  paths:
    - /var/lib/docker/containers/*/*.log
    - /var/log/syslog
setup.template.settings:
  index.number_of_shards: 3
output.elasticsearch:
  hosts: ["localhost:9200"]
rpm安装的服务应进行了注册
systemctl start filebeat.service
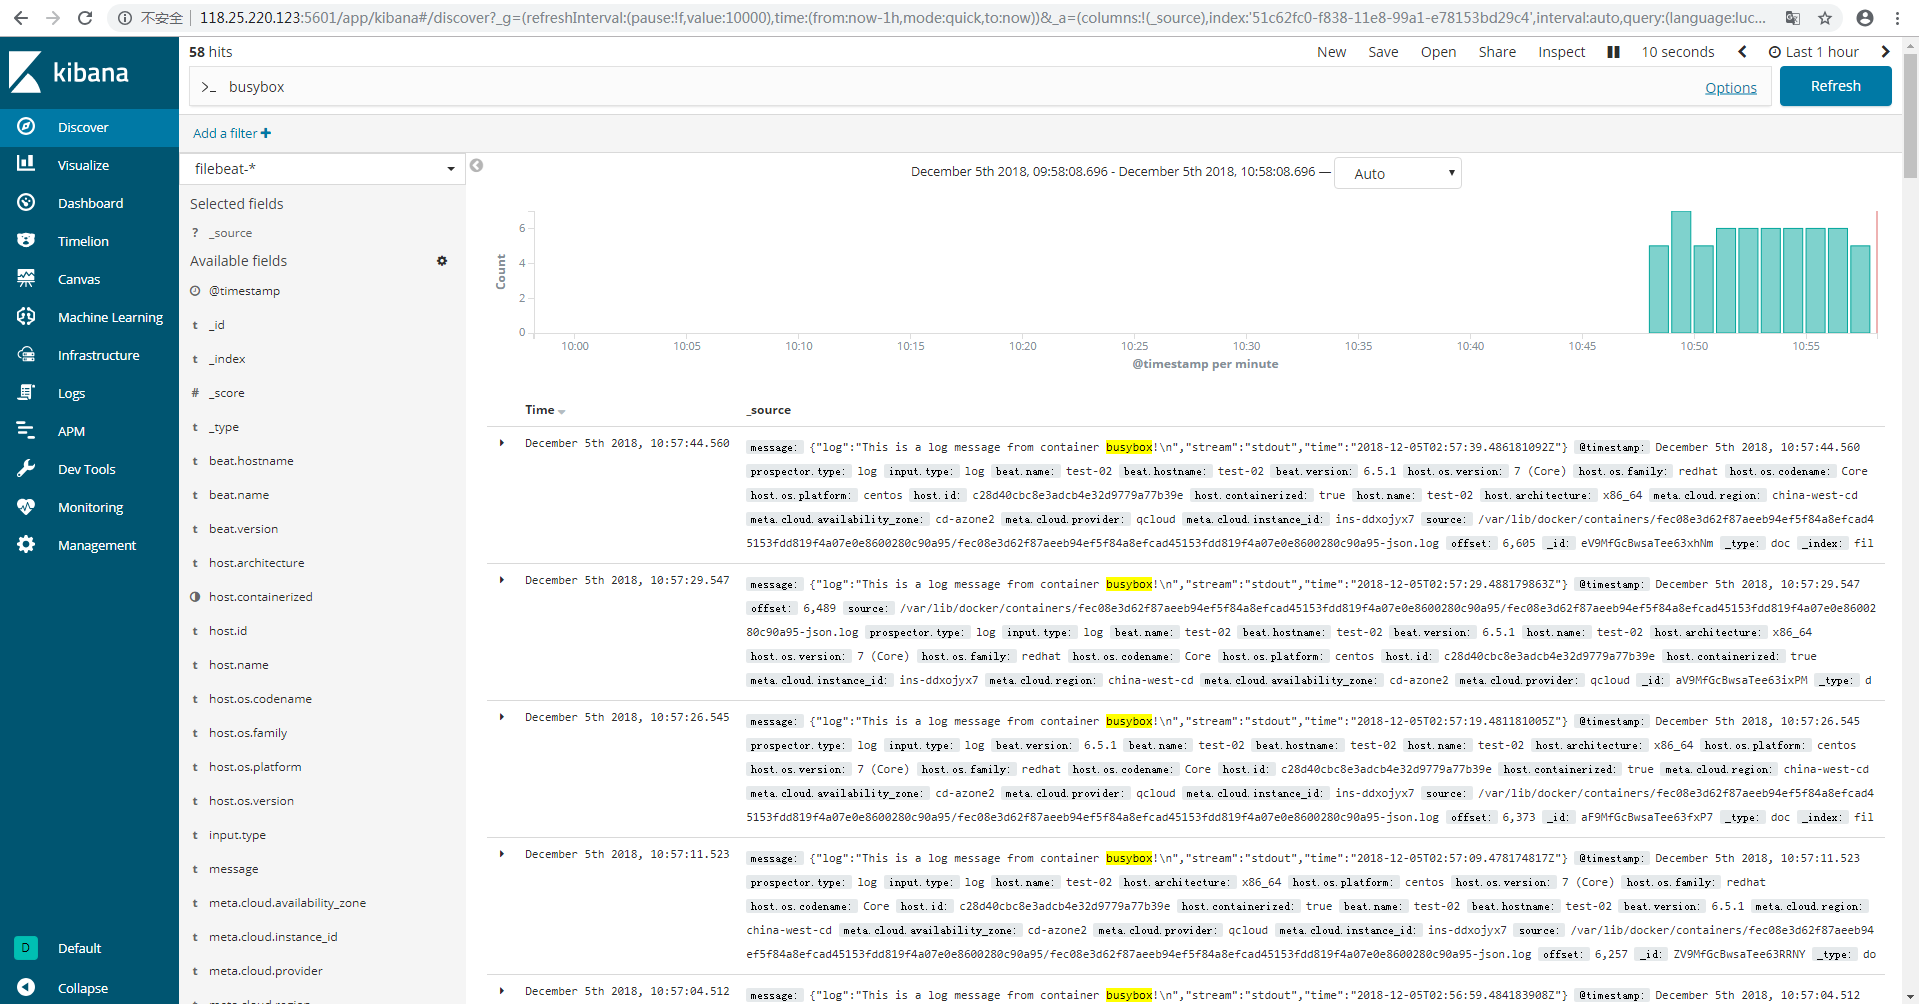
创建容器日志
[root@test-02 ~]# docker run busybox sh -c 'while true; do echo "This is a log message from container busybox!"; sleep 10; done;'
This is a log message from container busybox!
然后在kibana的索引filebeat-*中搜索
Fluentd
Fluentd是一种开源的数据收集器,有超过500种的plugin,可以连接各种数据源和数据输出组件。
docker run -d -p 24224:24224 -p 24224:24224/udp -v /data:/fluentd/log fluent/fluentd
修改配置文件/etc/filebeat/filebeat.yml
- type: log
  paths:
    - /data/*.log
重启filebeat
systemctl restart filebeat.service
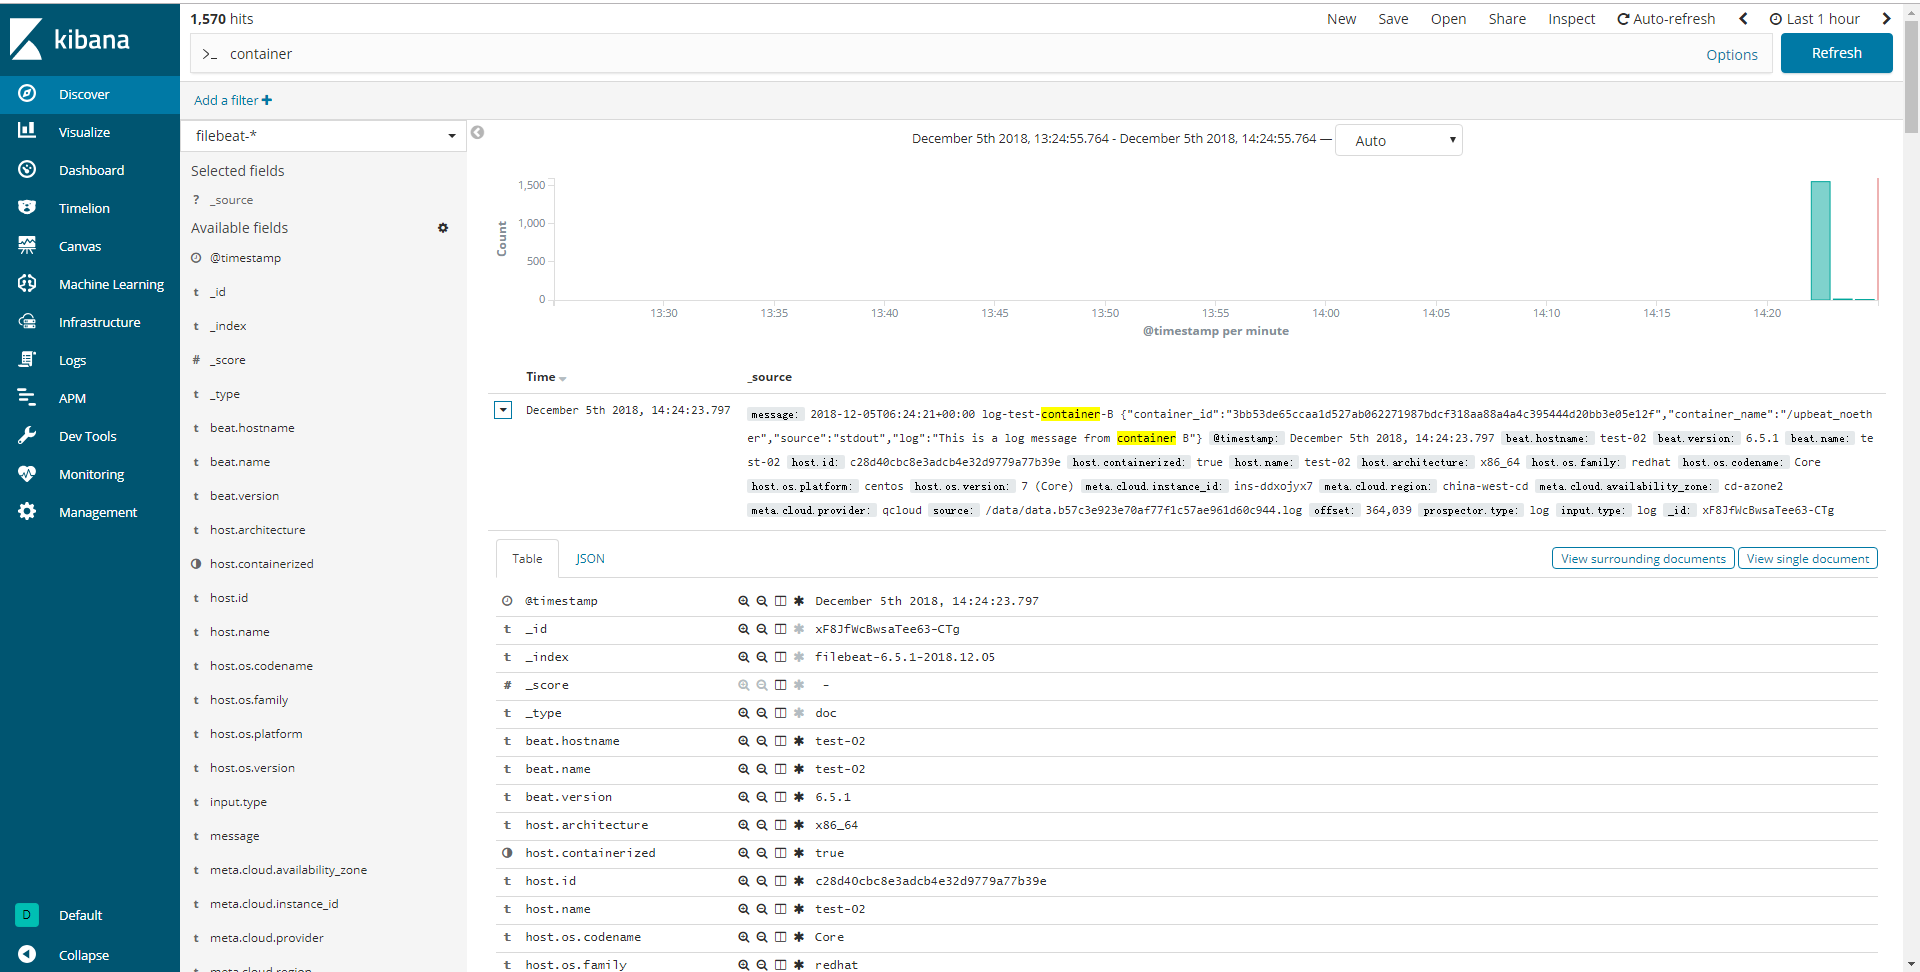
启动测试容器
docker run -d \
--log-driver=fluentd \
--log-opt fluentd-address=127.0.0.1:24224 \
--log-opt tag="log-test-container-A" \
busybox sh -c 'while true; do echo "This is a log message from container A"; sleep 10; done;'
在启动一个
docker run -d \
--log-driver=fluentd \
--log-opt fluentd-address=127.0.0.1:24224 \
--log-opt tag="log-test-container-B" \
busybox sh -c 'while true; do echo "This is a log message from container B"; sleep 10; done;'
--log-driver=fluentd告诉Docker使用Fluentd的logging driver。--log-opt fluentd-address=localhost:24224将容器日志发送到Fluentd的数据接收端口。--log-opt tag="log-test-container-A"和--log-opt tag="log-test-container-B"在日志中添加一个可选的tag,用于区分不同的容器。
Graylog
- Graylog负责接收来自各种设备和应用的日志,并为用户提供 Web 访问接口。
- Elasticsearch用于索引和保存 Graylog 接收到的日志。
- MongoDB负责保存Graylog自身的配置信息

