<服务>zabbix通过web端使用
目录:
安装zabbix
安装依赖
[root@heartbeat1 ~]# yum install -y zabbix22-server zabbix22-web zabbix22-web-mysql zabbix22-dbfiles-mysql zabbix22-agent
创建zabbix的数据库并添加对应的授权用户
[root@heartbeat1 ~]# mysql -u root -p
Enter password:
Welcome to the MySQL monitor.  Commands end with ; or \g.
Your MySQL connection id is 2
Server version: 5.5.32 MySQL Community Server (GPL)

Copyright (c) 2000, 2013, Oracle and/or its affiliates. All rights reserved.

Oracle is a registered trademark of Oracle Corporation and/or its
affiliates. Other names may be trademarks of their respective
owners.

Type 'help;' or '\h' for help. Type '\c' to clear the current input statement.

mysql> create database zabbix default charset utf8;
Query OK, 1 row affected (0.00 sec)

mysql> grant all on zabbix.* to zabbix@'192.168.0.203' identified by 'zabbix';
Query OK, 0 rows affected (0.00 sec)
导入数据
[root@heartbeat1 ~]# find / -name data.sql
/usr/share/zabbix-mysql/data.sql
[root@heartbeat1 ~]# cd /usr/share/zabbix-mysql
[root@heartbeat1 zabbix-mysql]# ll
total 2992
-rw-r--r-- 1 root root  969988 Dec  9 07:44 data.sql
-rw-r--r-- 1 root root 1978341 Dec  7 18:02 images.sql
-rw-r--r-- 1 root root  106560 Dec  7 18:05 schema.sql
drwxr-xr-x 5 root root    4096 Mar 24 23:34 upgrades
[root@heartbeat1 zabbix-mysql]# mysql -u root -p zabbix < schema.sql
Enter password:
[root@heartbeat1 zabbix-mysql]# mysql -u root -p zabbix < images.sql
Enter password:
[root@heartbeat1 zabbix-mysql]# mysql -u root -p zabbix < data.sql
Enter password:
[root@heartbeat1 zabbix-mysql]# cd /etc/zabbix
[root@heartbeat1 zabbix]# ll
total 4
lrwxrwxrwx 1 root   root     31 Mar 24 23:34 alertscripts -> /var/lib/zabbixsrv/alertscripts
lrwxrwxrwx 1 root   root     34 Mar 24 23:34 externalscripts -> /var/lib/zabbixsrv/externalscripts
drwxr-x--- 2 apache apache 4096 Mar 24 23:34 web
lrwxrwxrwx 1 root   root     22 Mar 24 23:34 zabbix_agent.conf -> /etc/zabbix_agent.conf
lrwxrwxrwx 1 root   root     23 Mar 24 23:34 zabbix_agentd.conf -> /etc/zabbix_agentd.conf
lrwxrwxrwx 1 root   root     23 Mar 24 23:34 zabbix_server.conf -> /etc/zabbix_server.conf
配置zabbix
[root@heartbeat1 zabbix]# vim zabbix_server.conf
修改内容与mysql配置一致
DBHost=192.168.0.203
DBName=zabbix
DBUser=zabbix
DBPassword=zabbix
启动zabbix
[root@heartbeat1 zabbix]# service zabbix-server start
Starting Zabbix server:                                    [确定]
[root@heartbeat1 zabbix]# ps -ef | grep zabbix
495       3003     1  0 00:21 ?        00:00:00 /usr/sbin/zabbix_server -c /etc/zabbix_server.conf
495       3006  3003  0 00:21 ?        00:00:00 /usr/sbin/zabbix_server: configuration syncer [waiting 60 sec for processes]
495       3007  3003  0 00:21 ?        00:00:00 /usr/sbin/zabbix_server: db watchdog [synced alerts config in 0.004519 sec, idle 60 sec]
495       3008  3003  0 00:21 ?        00:00:00 /usr/sbin/zabbix_server: poller #1 [got 0 values in 0.000001 sec, idle 5 sec]
495       3010  3003  0 00:21 ?        00:00:00 /usr/sbin/zabbix_server: poller #2 [got 0 values in 0.000001 sec, idle 5 sec]
495       3011  3003  0 00:21 ?        00:00:00 /usr/sbin/zabbix_server: poller #3 [got 0 values in 0.000002 sec, idle 5 sec]
495       3012  3003  0 00:21 ?        00:00:00 /usr/sbin/zabbix_server: poller #4 [got 0 values in 0.000001 sec, idle 5 sec]
495       3013  3003  0 00:21 ?        00:00:00 /usr/sbin/zabbix_server: poller #5 [got 0 values in 0.000001 sec, idle 5 sec]
495       3014  3003  0 00:21 ?        00:00:00 /usr/sbin/zabbix_server: unreachable poller #1 [got 0 values in 0.000002 sec, idle 5 sec]
495       3015  3003  0 00:21 ?        00:00:00 /usr/sbin/zabbix_server: trapper #1 [processed data in 0.000000 sec, waiting for connection]
495       3016  3003  0 00:21 ?        00:00:00 /usr/sbin/zabbix_server: trapper #2 [processed data in 0.000000 sec, waiting for connection]
495       3017  3003  0 00:21 ?        00:00:00 /usr/sbin/zabbix_server: trapper #3 [processed data in 0.000000 sec, waiting for connection]
495       3018  3003  0 00:21 ?        00:00:00 /usr/sbin/zabbix_server: trapper #4 [processed data in 0.000000 sec, waiting for connection]
495       3022  3003  0 00:21 ?        00:00:00 /usr/sbin/zabbix_server: trapper #5 [processed data in 0.000000 sec, waiting for connection]
495       3023  3003  0 00:21 ?        00:00:00 /usr/sbin/zabbix_server: icmp pinger #1 [got 0 values in 0.000003 sec, idle 5 sec]
495       3024  3003  0 00:21 ?        00:00:00 /usr/sbin/zabbix_server: alerter [sent alerts: 0 success, 0 fail in 0.001476 sec, idle 30 sec]
495       3025  3003  0 00:21 ?        00:00:00 /usr/sbin/zabbix_server: housekeeper [deleted 0 hist/trends, 0 items, 0 events, 0 sessions, 0 alarms, 0 audit items in 0.135696 sec, idle 1 hour(s)]
495       3030  3003  0 00:21 ?        00:00:00 /usr/sbin/zabbix_server: timer #1 [processed 0 triggers, 0 events in 0.000000 sec, 0 maintenances in 0.000000 sec, idle 26 sec]
495       3032  3003  0 00:21 ?        00:00:00 /usr/sbin/zabbix_server: http poller #1 [got 0 values in 0.000344 sec, idle 5 sec]
495       3034  3003  0 00:21 ?        00:00:00 /usr/sbin/zabbix_server: discoverer #1 [processed 0 rules in 0.000627 sec, idle 60 sec]
495       3035  3003  0 00:21 ?        00:00:00 /usr/sbin/zabbix_server: history syncer #1 [synced 0 items in 0.000001 sec, idle 5 sec]
495       3036  3003  0 00:21 ?        00:00:00 /usr/sbin/zabbix_server: history syncer #2 [synced 0 items in 0.000001 sec, idle 5 sec]
495       3038  3003  0 00:21 ?        00:00:00 /usr/sbin/zabbix_server: history syncer #3 [synced 0 items in 0.000001 sec, idle 5 sec]
495       3041  3003  0 00:21 ?        00:00:00 /usr/sbin/zabbix_server: history syncer #4 [synced 0 items in 0.000001 sec, idle 5 sec]
495       3043  3003  0 00:21 ?        00:00:00 /usr/sbin/zabbix_server: escalator [processed 0 escalations in 0.000234 sec, idle 3 sec]
495       3044  3003  0 00:21 ?        00:00:00 /usr/sbin/zabbix_server: proxy poller #1 [exchanged data with 0 proxies in 0.000002 sec, idle 5 sec]
495       3047  3003  0 00:21 ?        00:00:00 /usr/sbin/zabbix_server: self-monitoring [processed data in 0.000002 sec, idle 1 sec]
root      3056  2499  0 00:21 pts/0    00:00:00 grep zabbix
通过web访问zabbix
[root@heartbeat1 zabbix]# ll /etc/httpd/conf.d/
total 24
-rw-r--r--  1 root root  392 May 12  2016 README
-rw-r--r--. 1 root root  118 May 20  2009 mod_dnssd.conf
-rw-r--r--  1 root root 1010 Jan 20 14:35 nagios.conf
-rw-r--r--  1 root root  674 May 11  2016 php.conf
-rw-r--r--  1 root root  299 Feb  4  2016 welcome.conf
-rw-r--r--  1 root root  895 Dec  9 07:42 zabbix.conf
启动http服务
[root@heartbeat1 zabbix]# service httpd start
正在启动 httpd:httpd: Could not reliably determine the server's fully qualified domain name, using 192.168.0.203 for ServerName
                                                           [确定]

访问http://192.168.0.203/zabbix
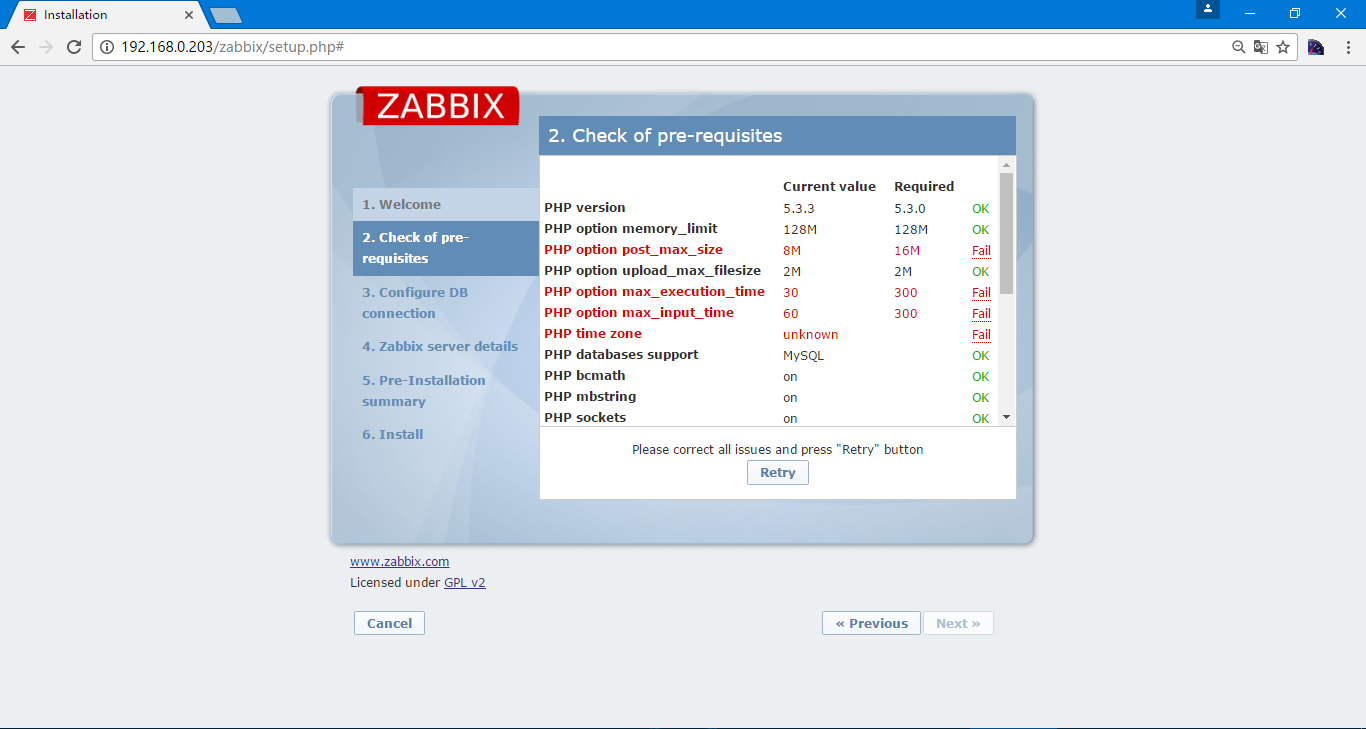
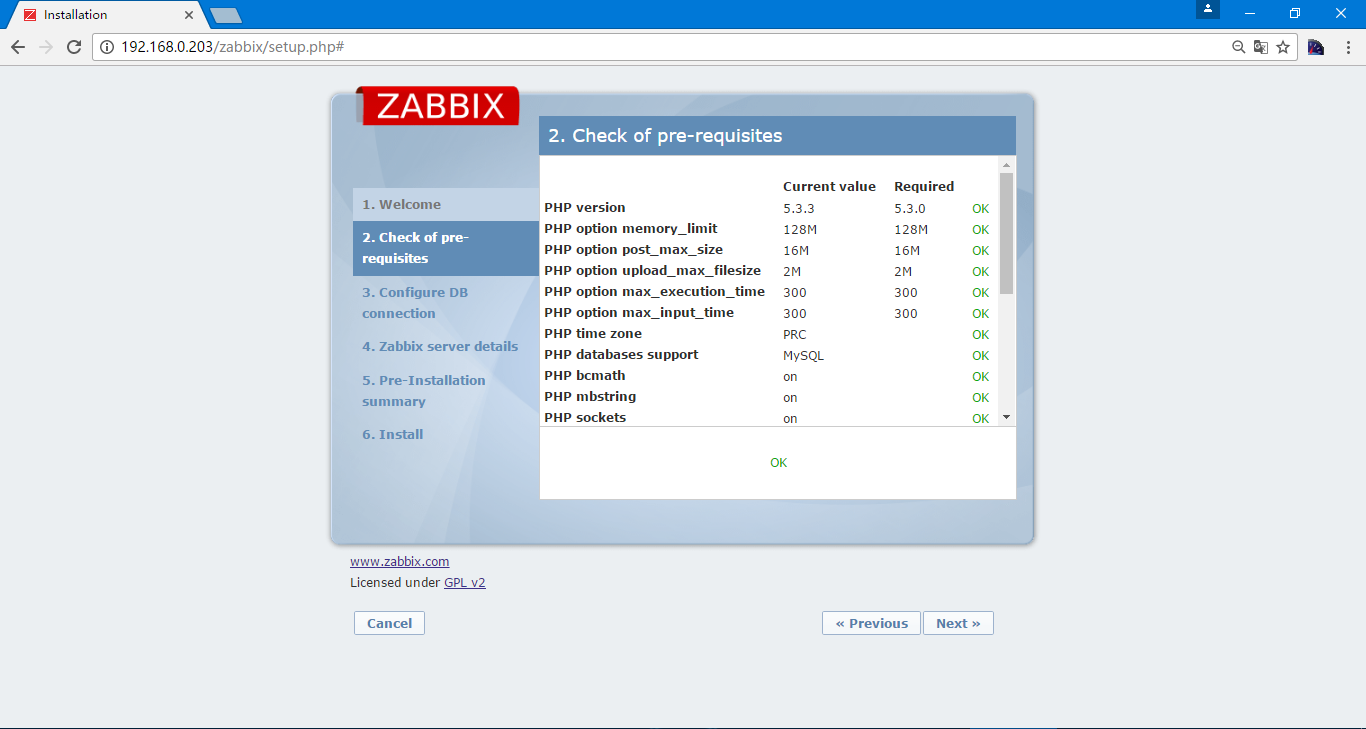
根据显示的错误项进行修改
[root@heartbeat1 zabbix]# vi /etc/php.ini
post_max_size = 16M
max_execution_time = 300
max_input_time = 300
date.timezone = PRC     #也可以是shanghai
[root@heartbeat1 zabbix]# service httpd restart
停止 httpd:                                               [确定]
正在启动 httpd:httpd: Could not reliably determine the server's fully qualified domain name, using 192.168.0.203 for ServerName
                                                           [确定]
重启后全部正常
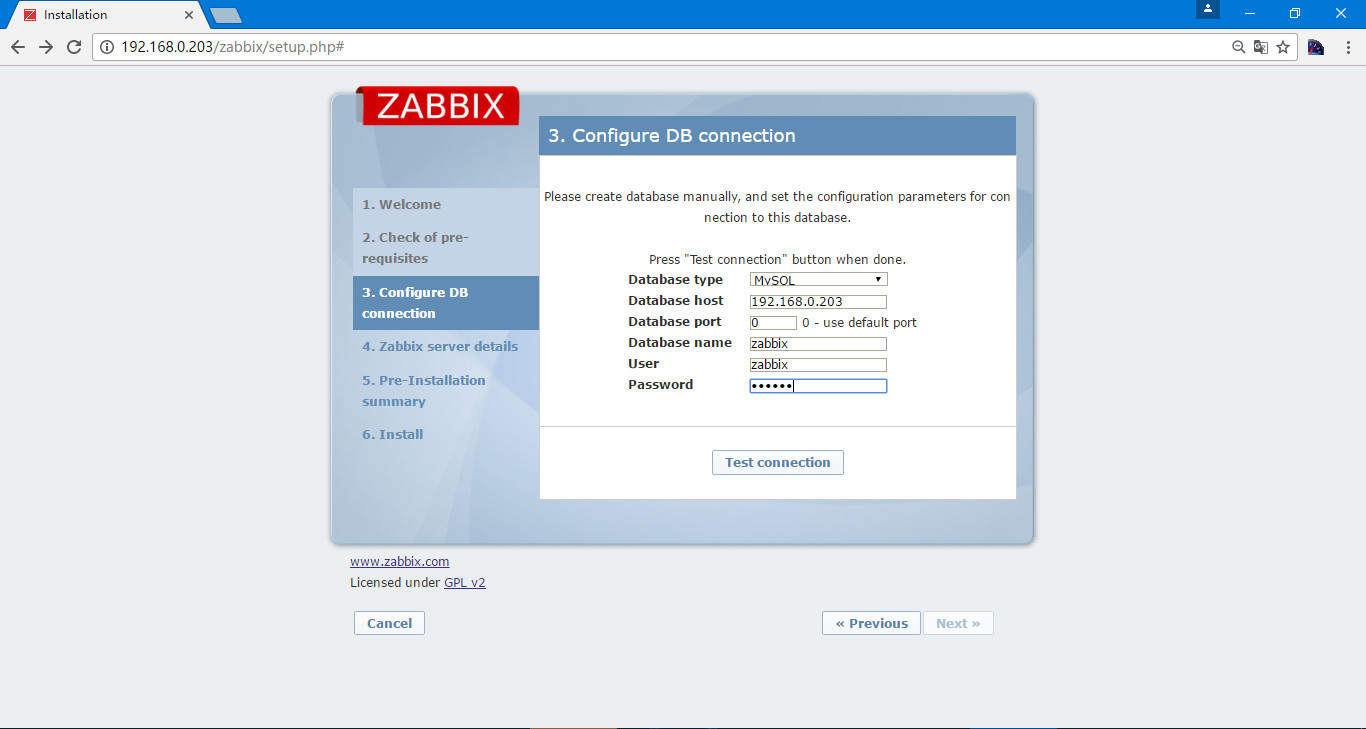
填写数据库连接
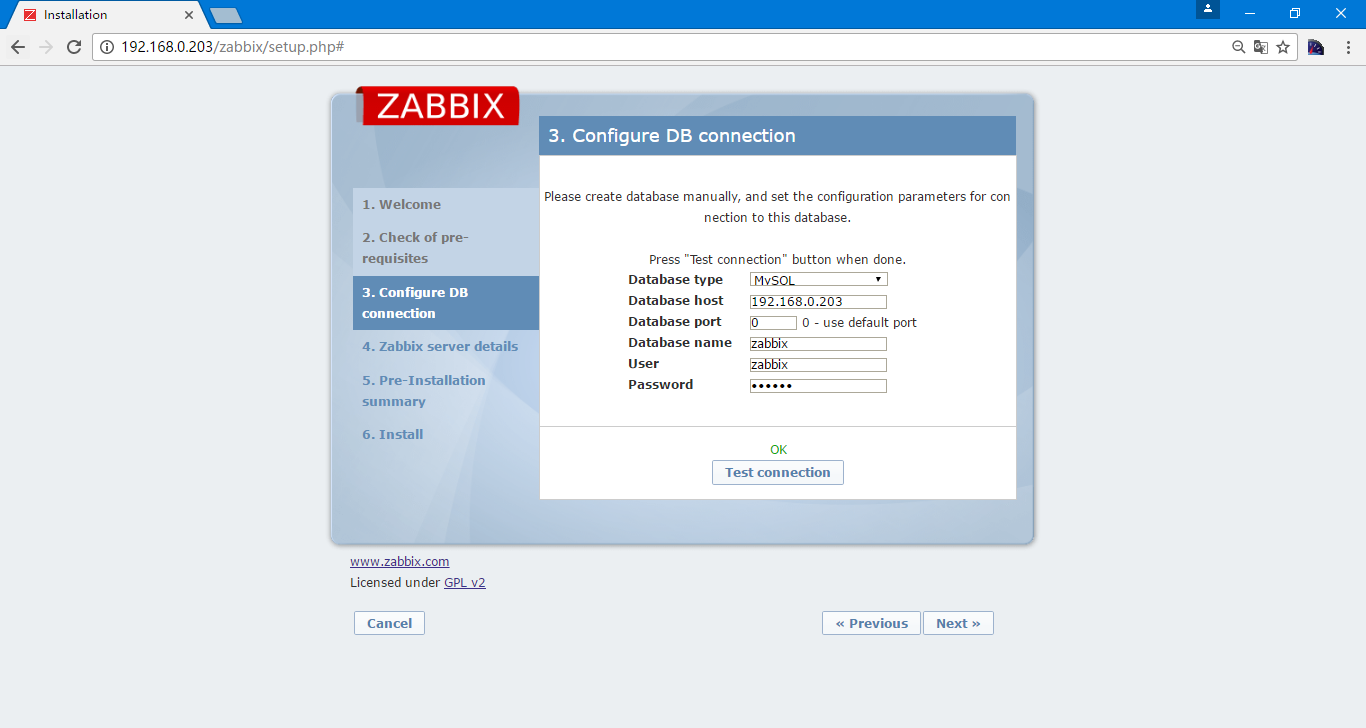
测试连接,正常的话会返回一个ok
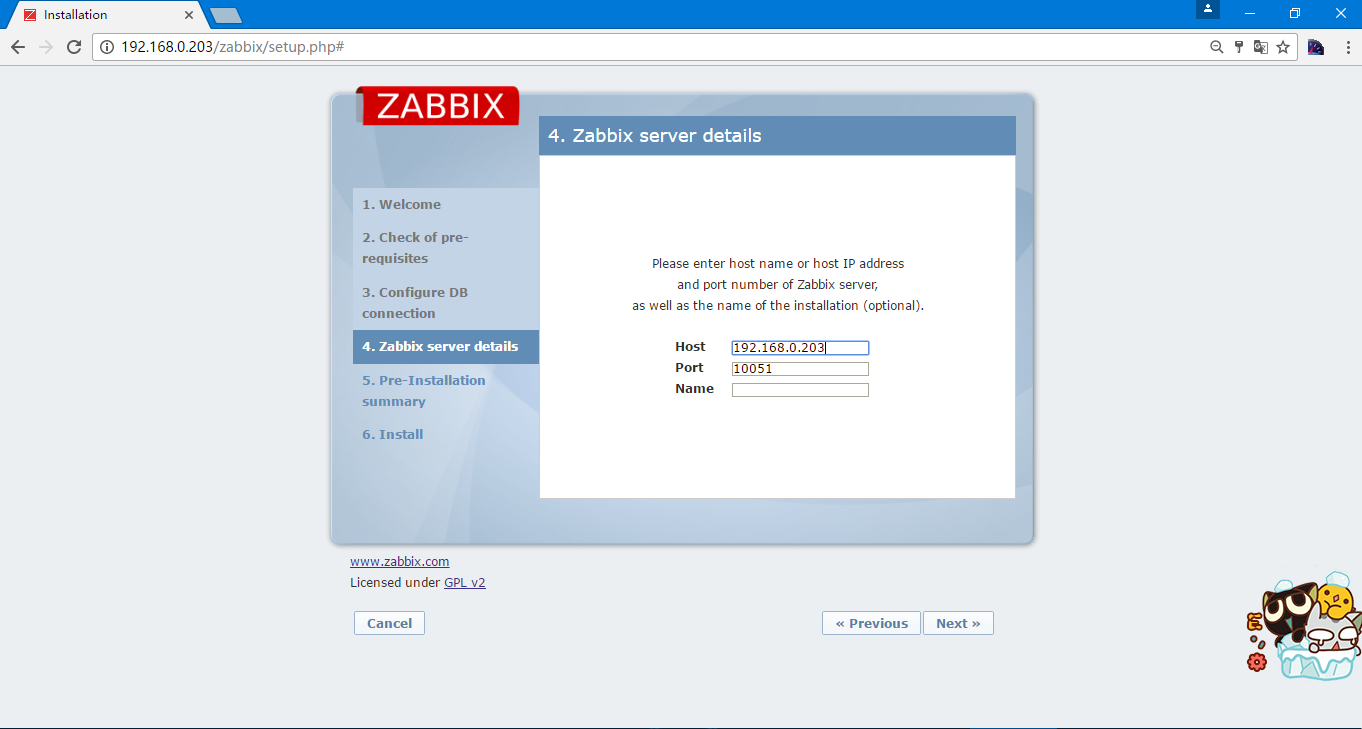
配置连接的zabbix-server
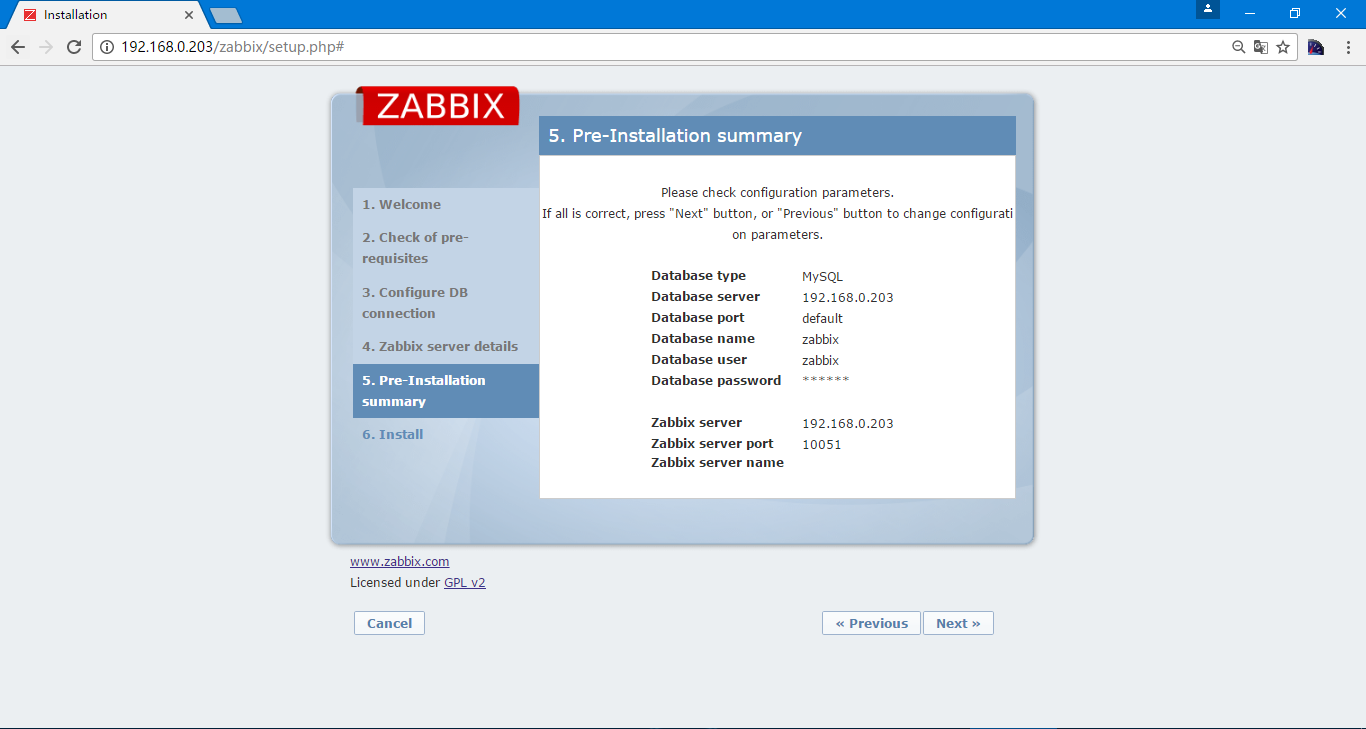
确认选项
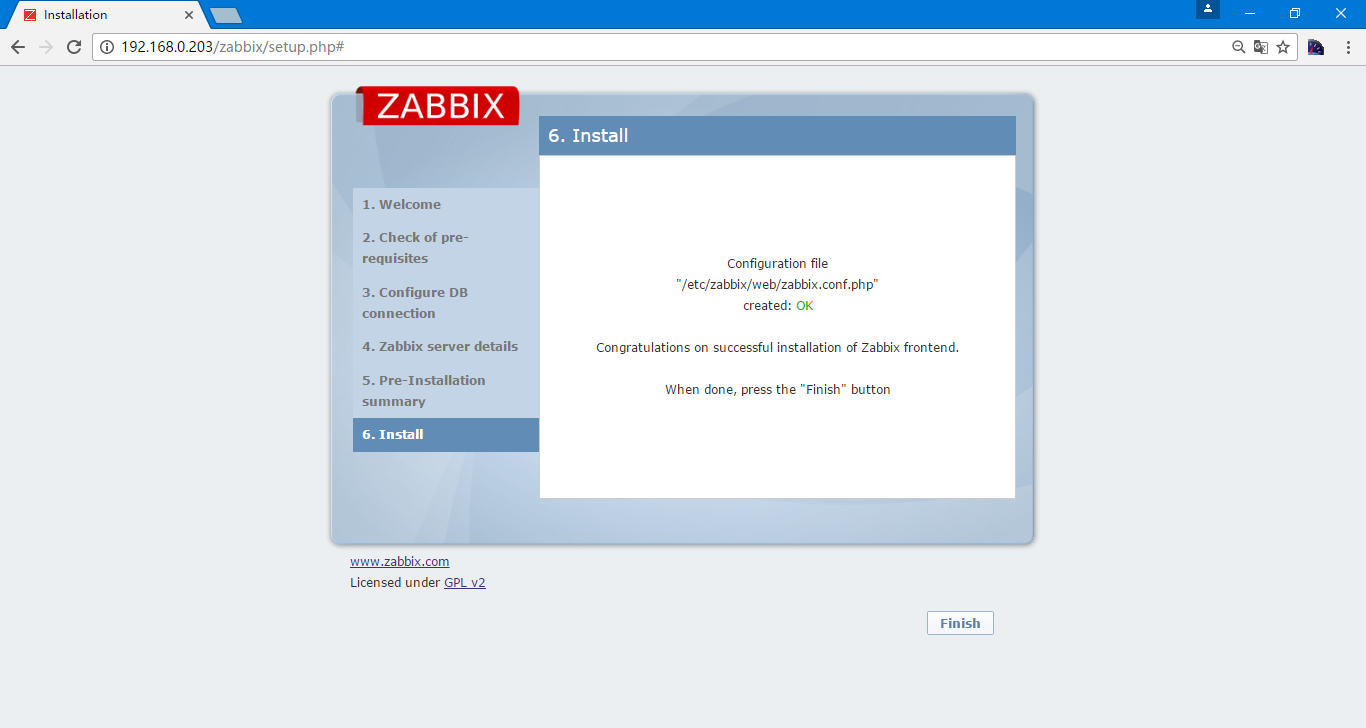
安装完成
web端使用zabbix监控
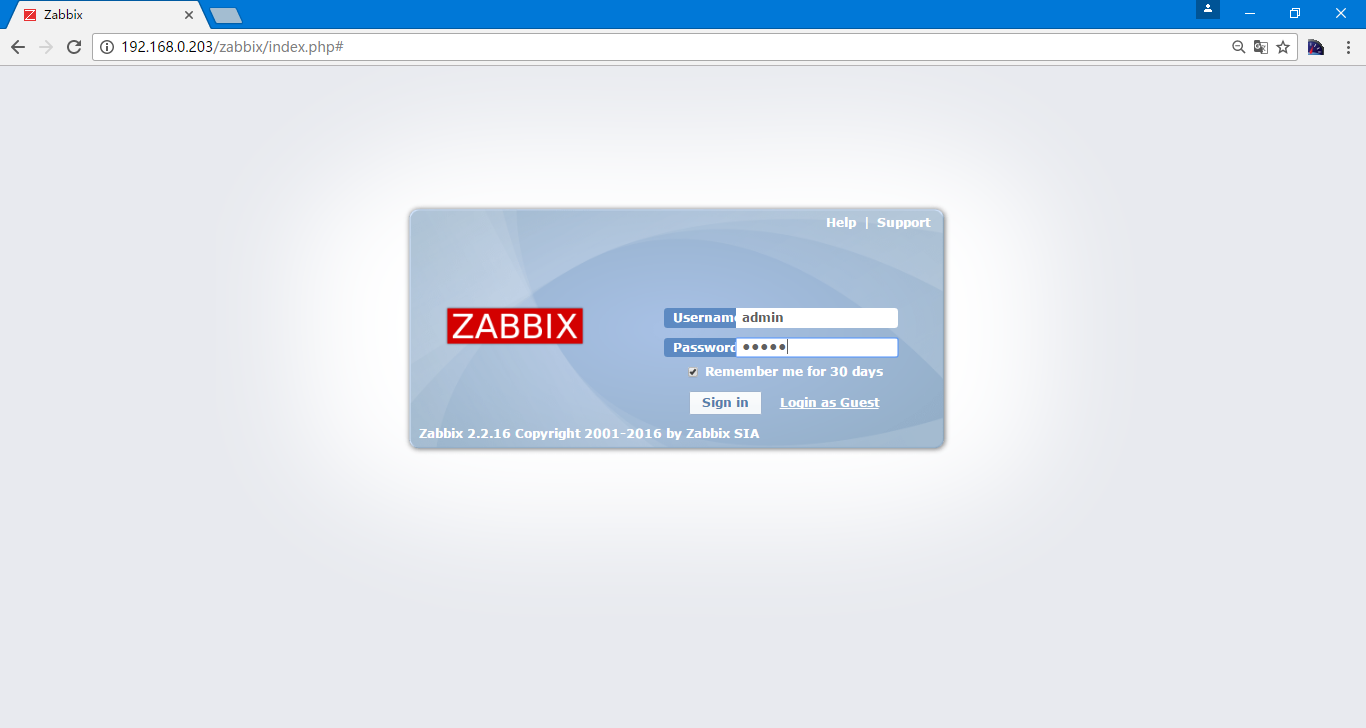
用户名密码登录,默认为Admin zabbix
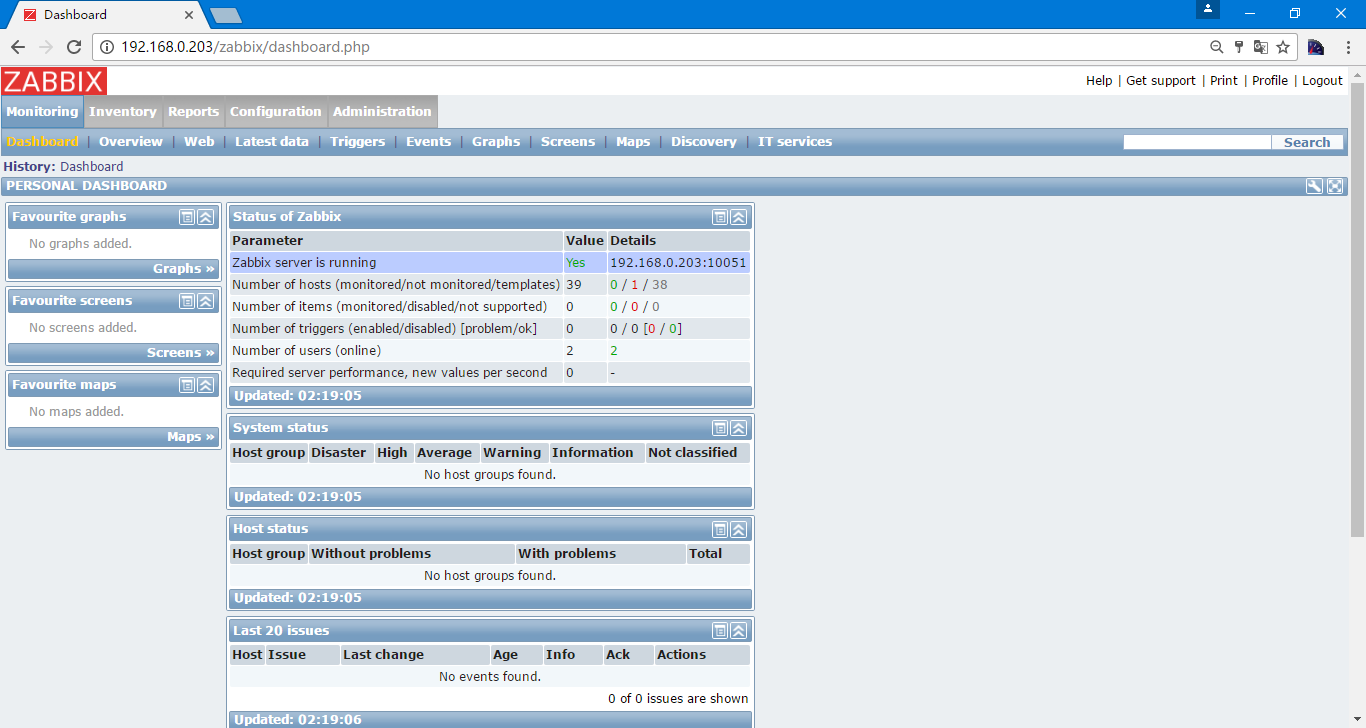
进入到zabbix界面
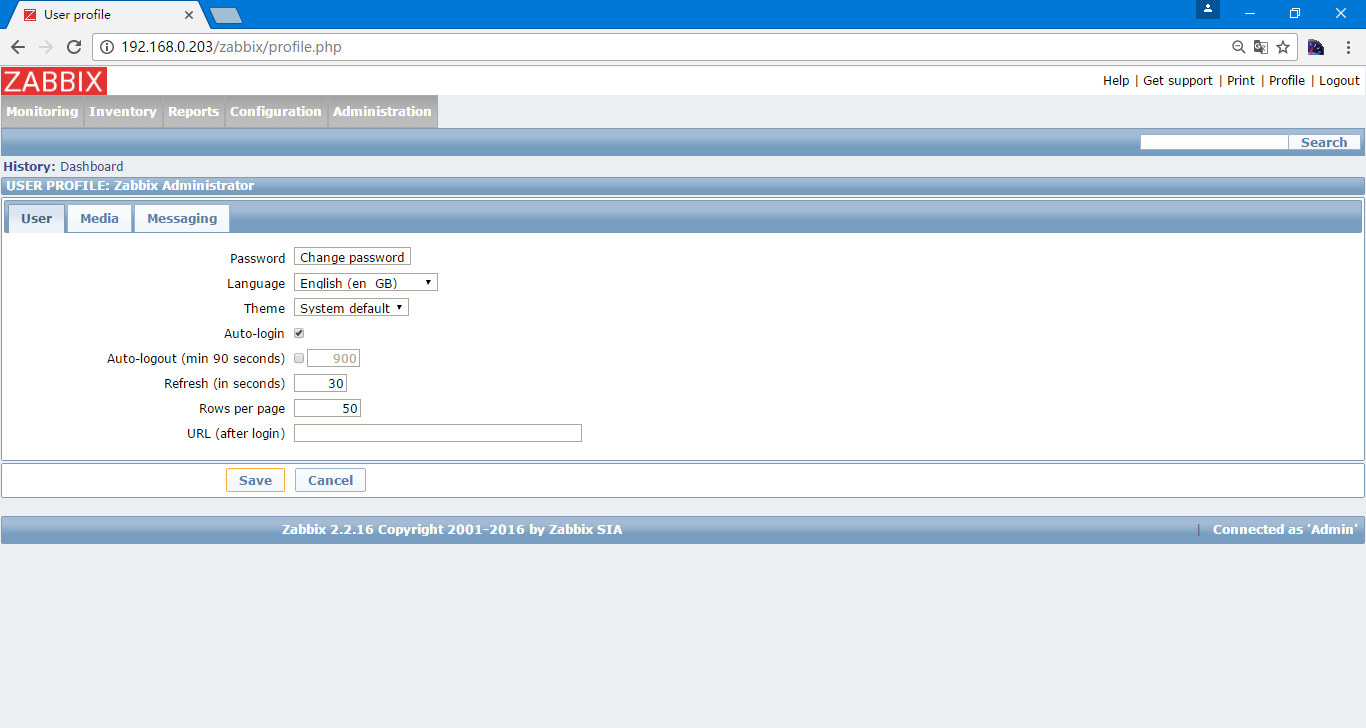
首选选择右上角的profile,可以选择修改密码,显示语言为中文等
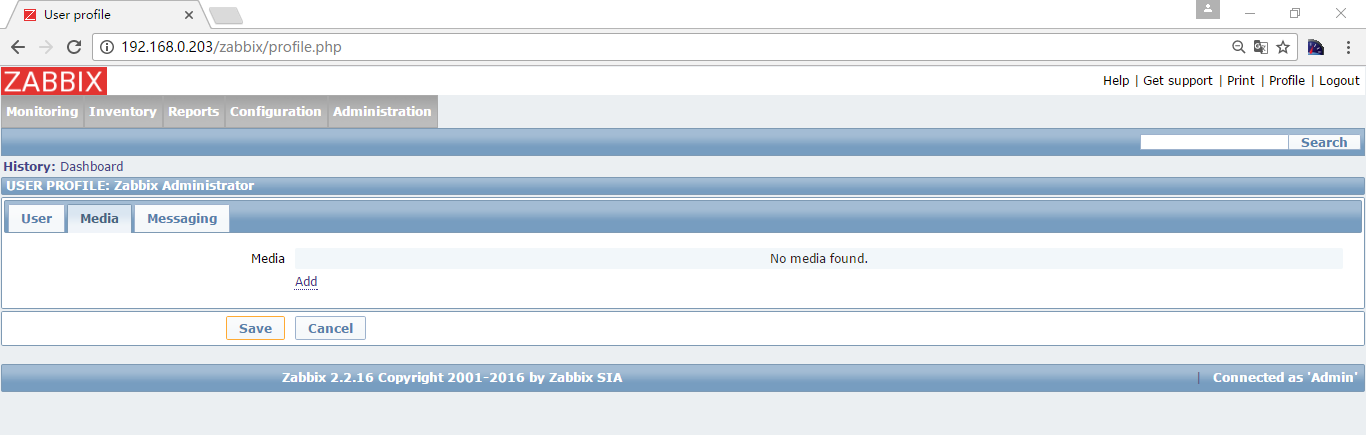
中间的media为通知的渠道
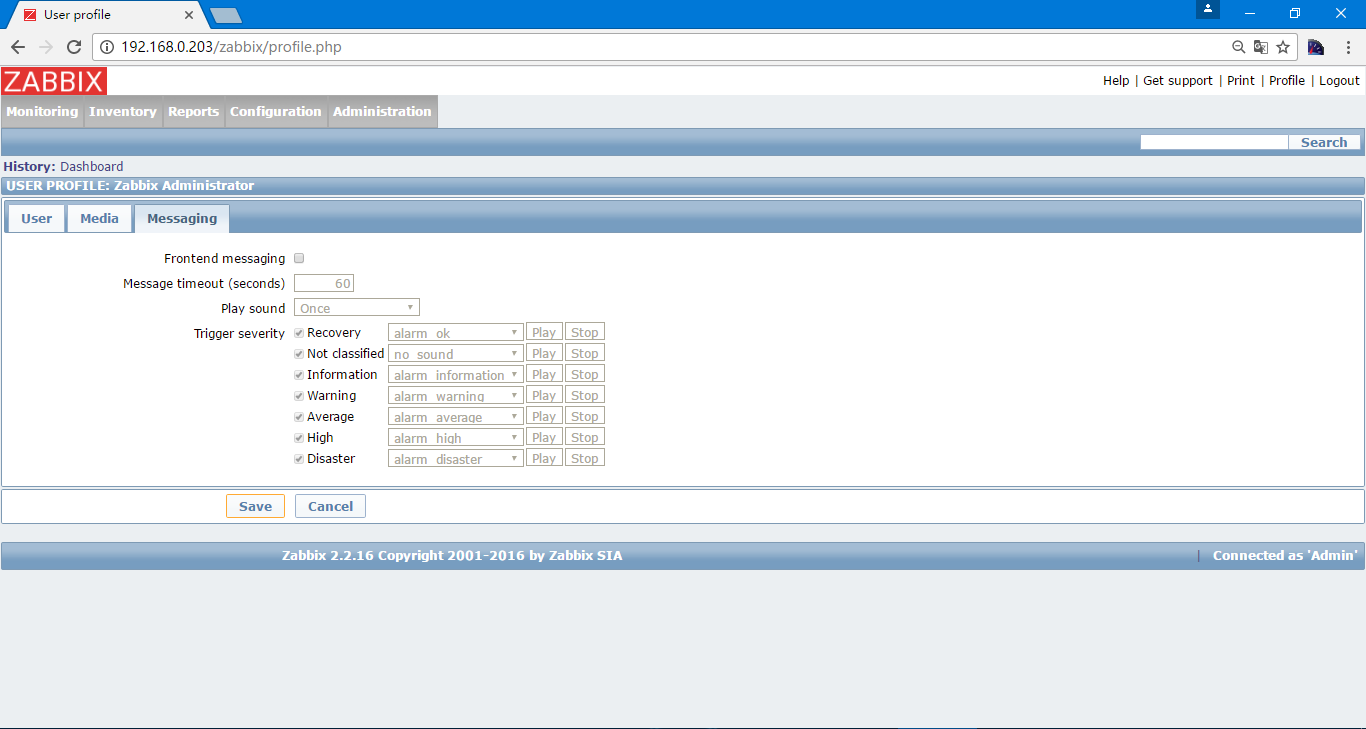
messaging可以配置报警声音等
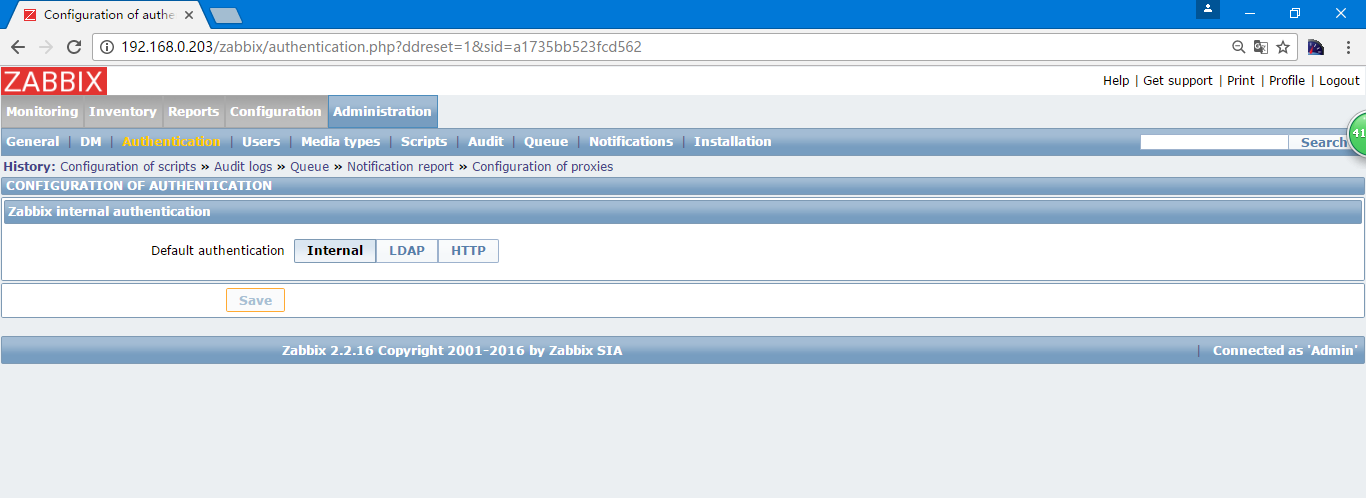
认证方式
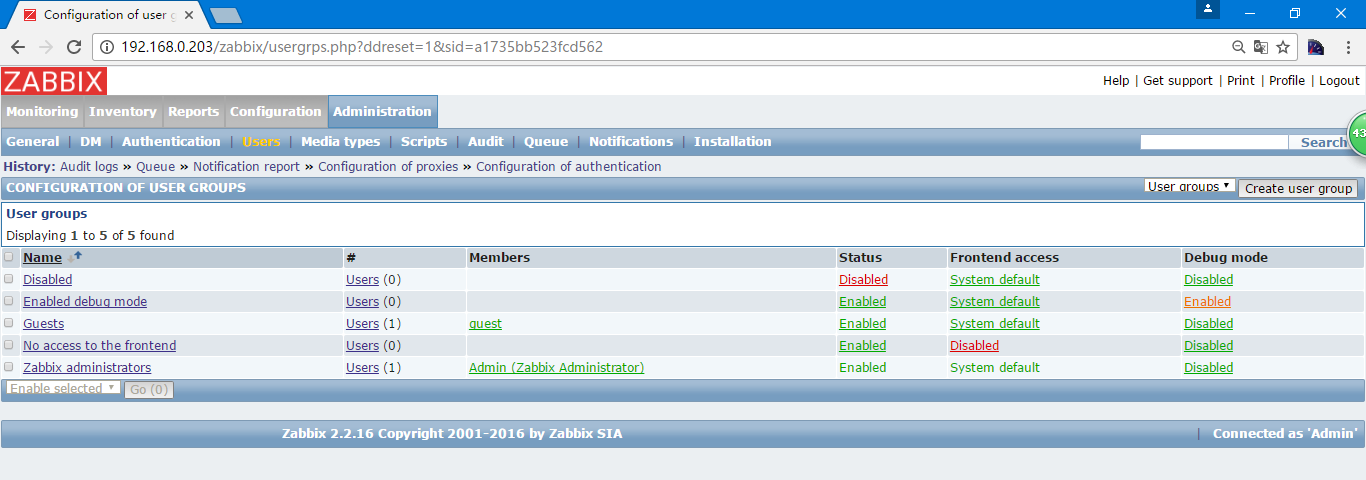
用户
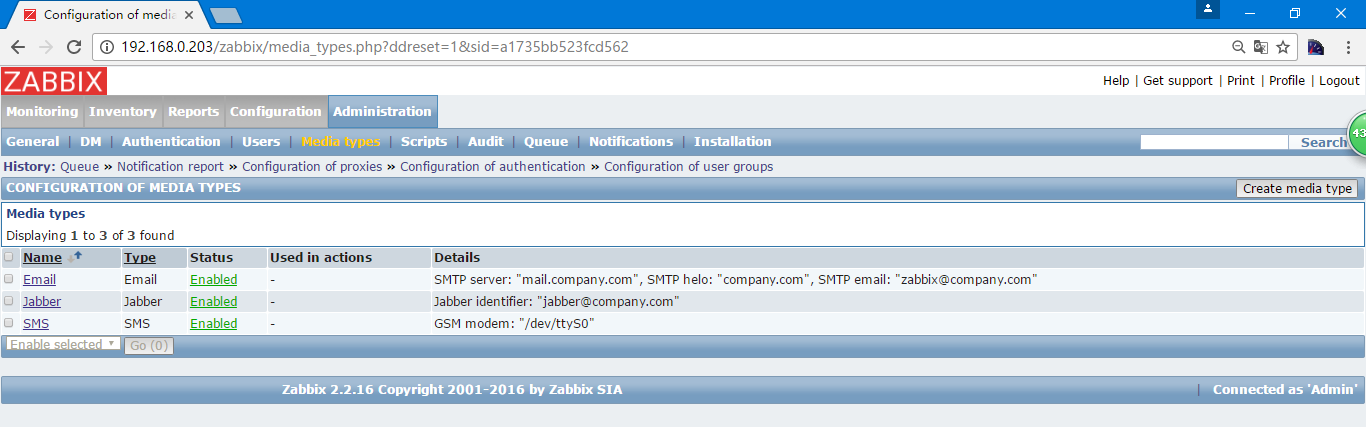
报警类型
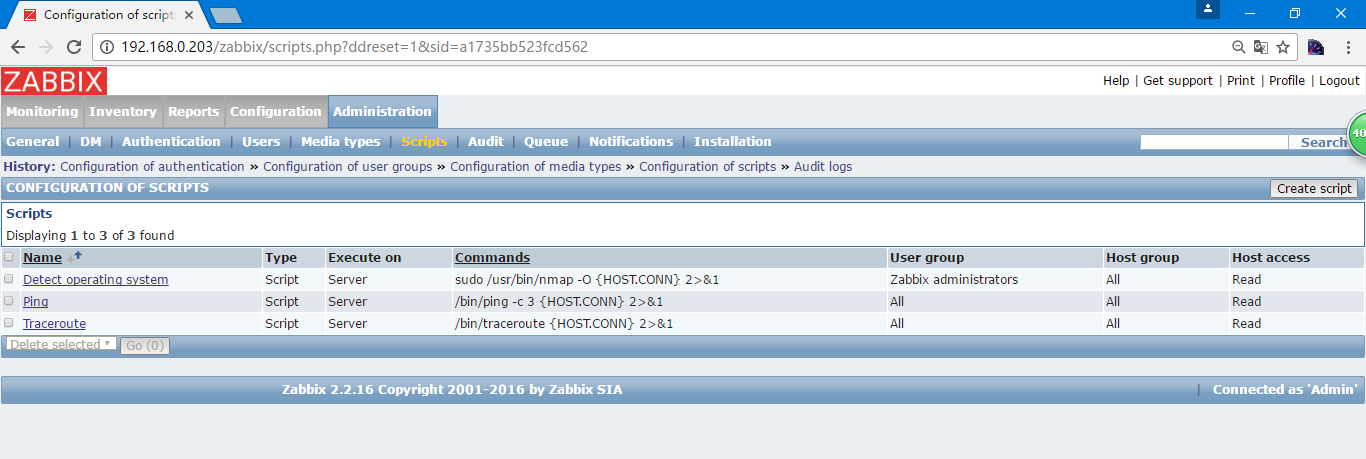
脚本
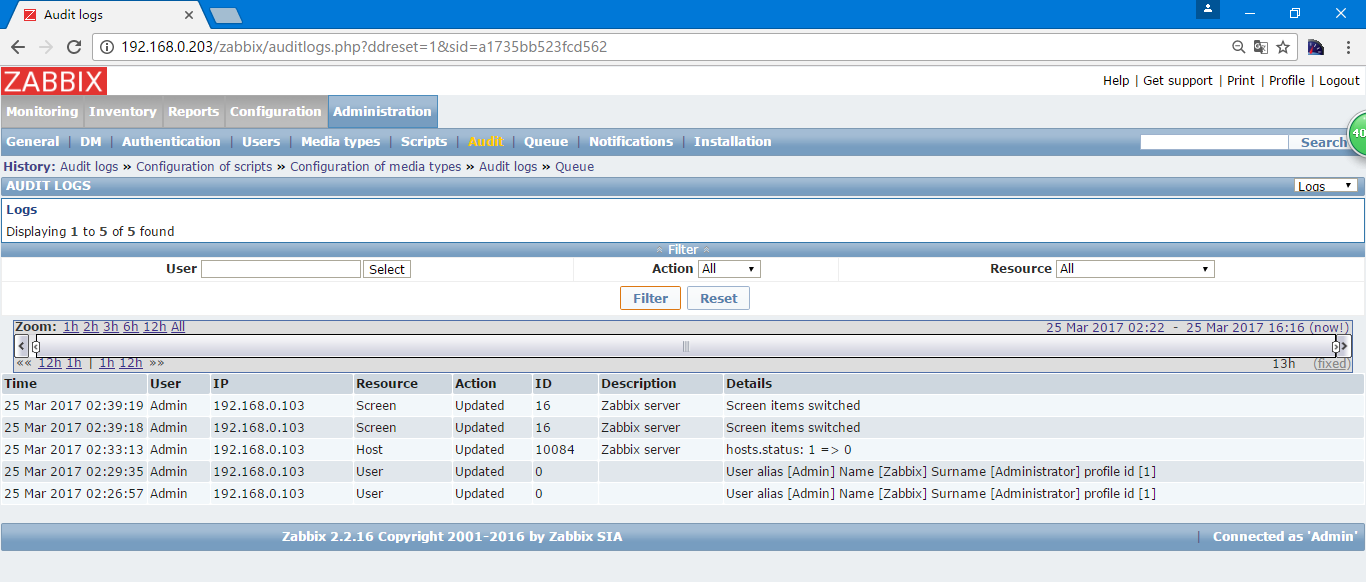
用户行为审计日志
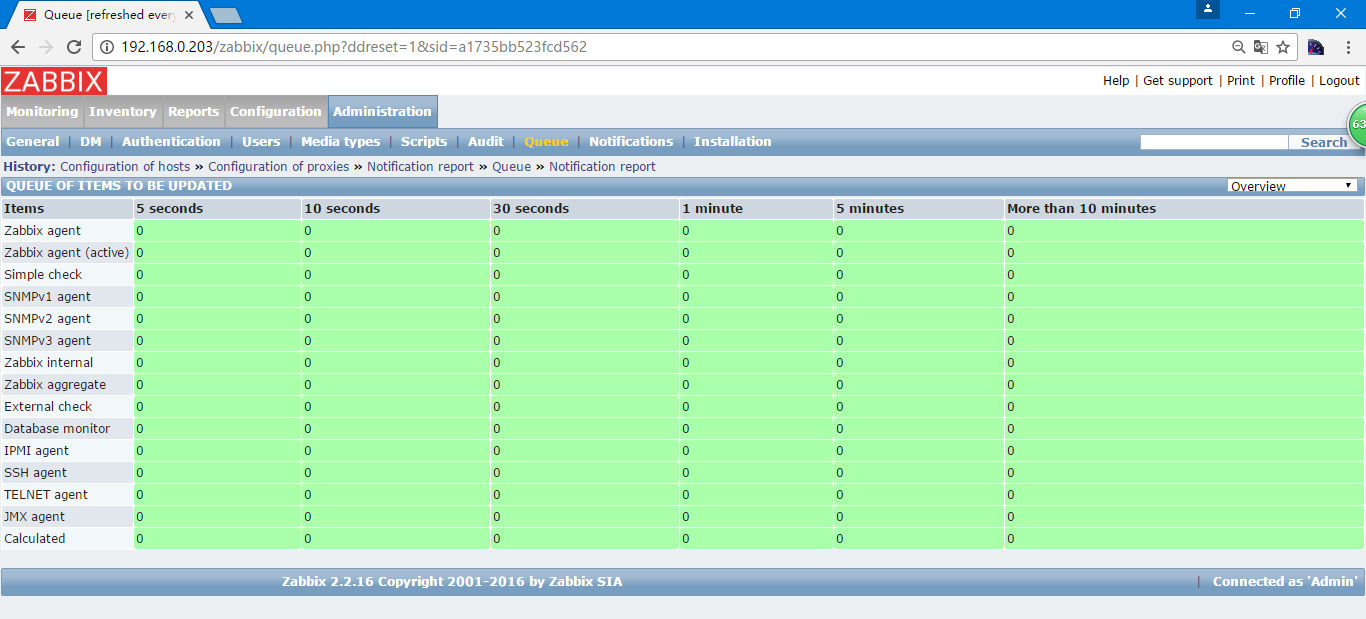
zabbix的监控队列,如果过大说明zabbix服务压力过大
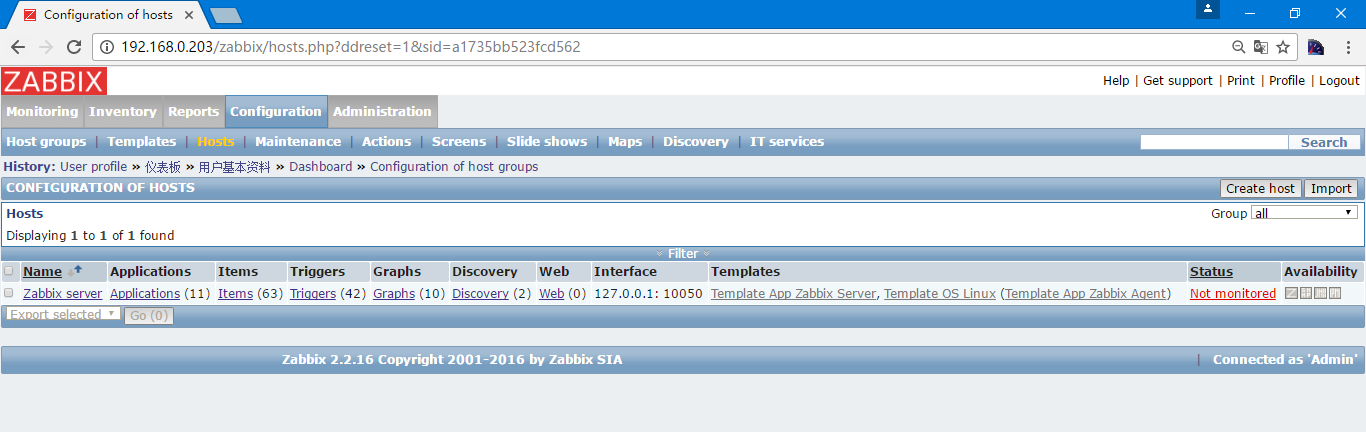
添加被监控主机
[root@heartbeat2 ~]# yum install -y zabbix22-agent
[root@heartbeat2 ~]# ll /etc/zabbix
total 0
lrwxrwxrwx 1 root root 22 Mar 25 16:34 zabbix_agent.conf -> /etc/zabbix_agent.conf              #模板配置文件
lrwxrwxrwx 1 root root 23 Mar 25 16:34 zabbix_agentd.conf -> /etc/zabbix_agentd.conf            #配置文件
[root@heartbeat2 ~]# vim /etc/zabbix/zabbix_agentd.conf
Server=192.168.0.203
[root@heartbeat2 ~]# /etc/init.d/zabbix-agentd start
Starting Zabbix agent:                                     [  OK  ]
[root@heartbeat2 ~]# chkconfig zabbix-agentd on
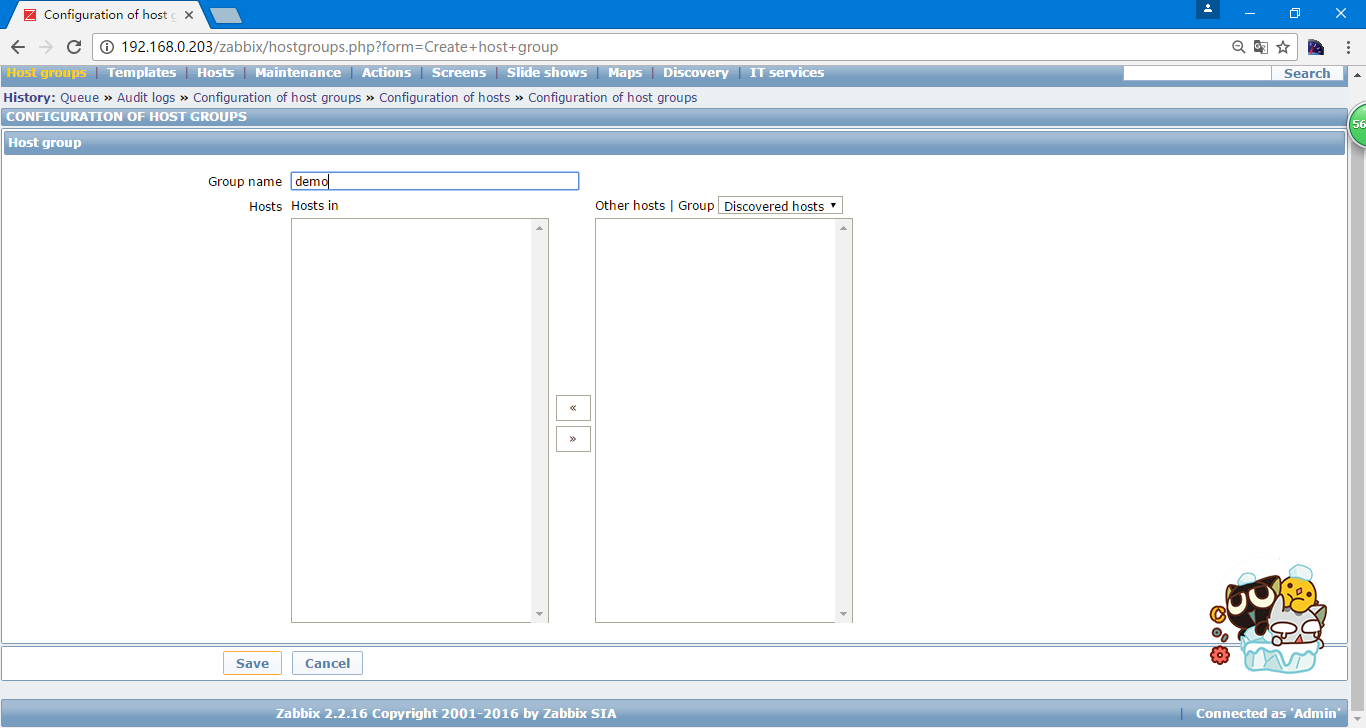
创建主机组
选择右上方的create host group ,进行组名的填写
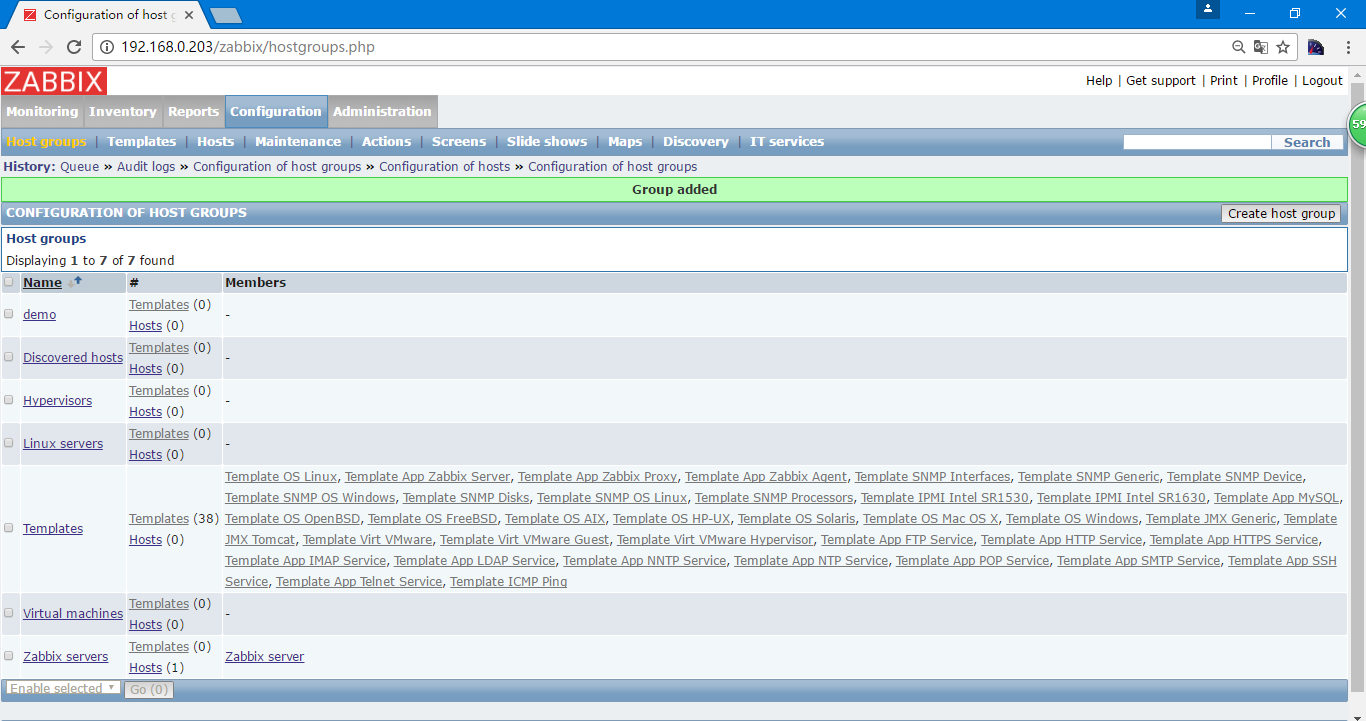
成功添加主机组
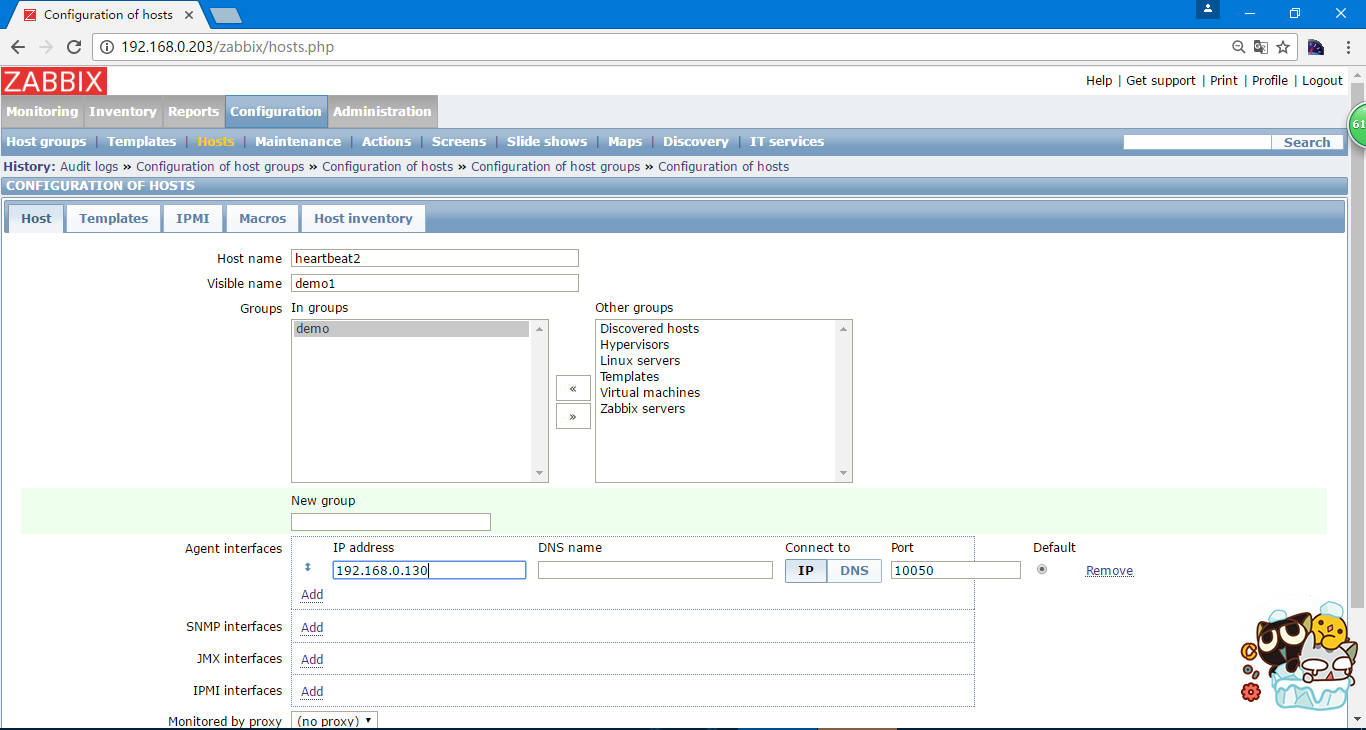
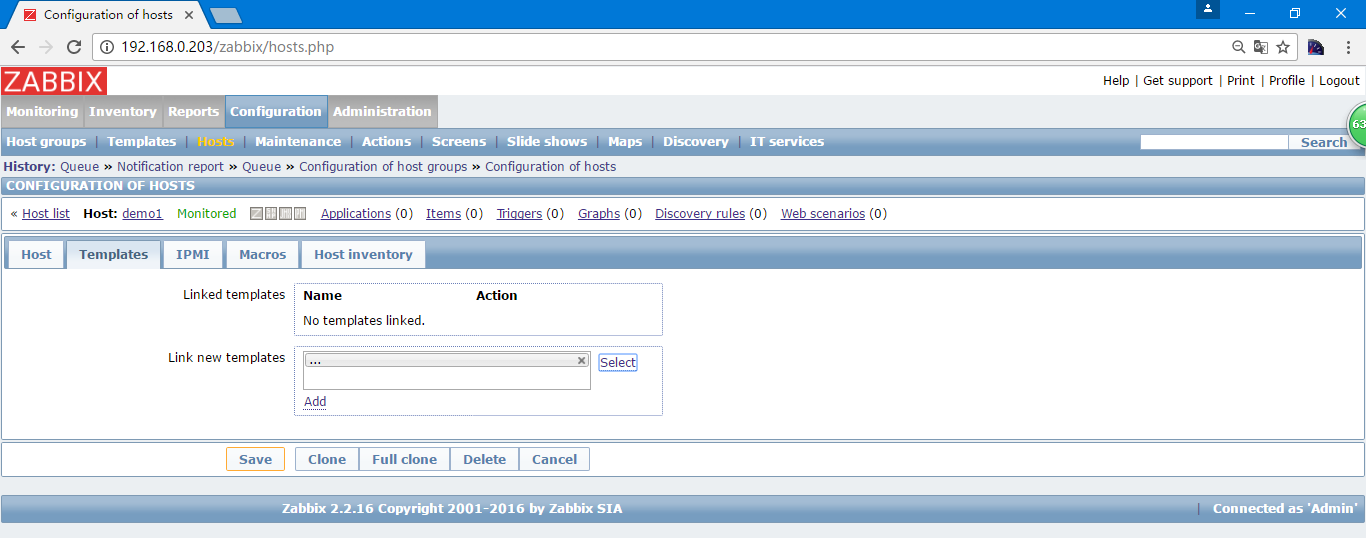
添加主机,在Host的右上角选择create host
选择templates标签,可以通过add添加模板,要先select
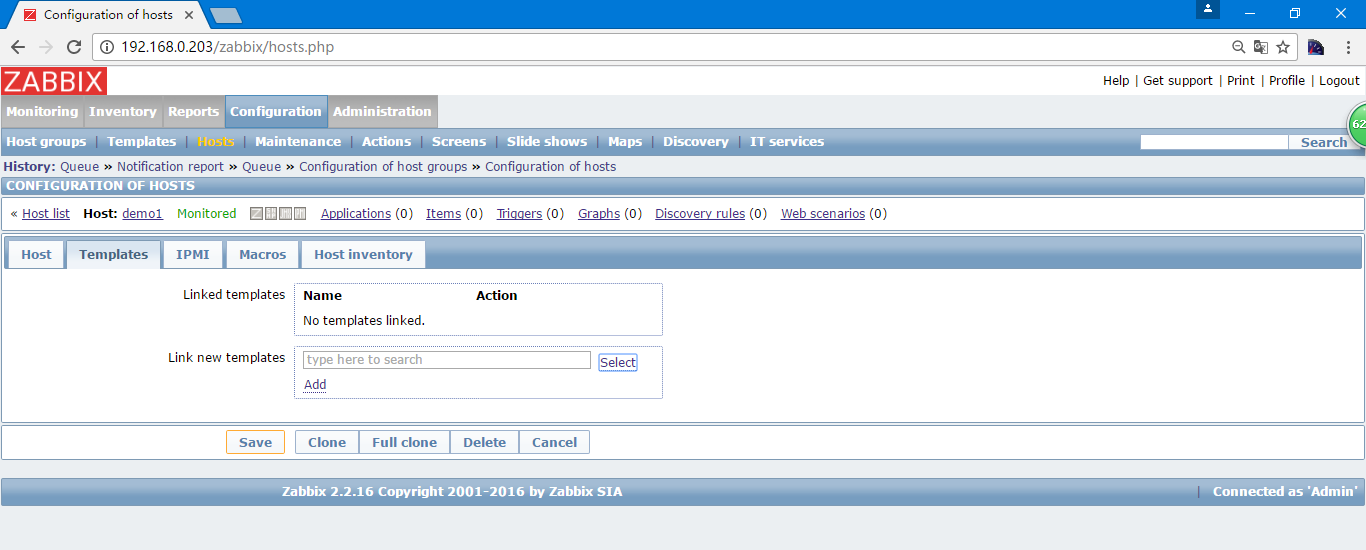
一般os linux就可以满足linux操作系统的监控需求了,select
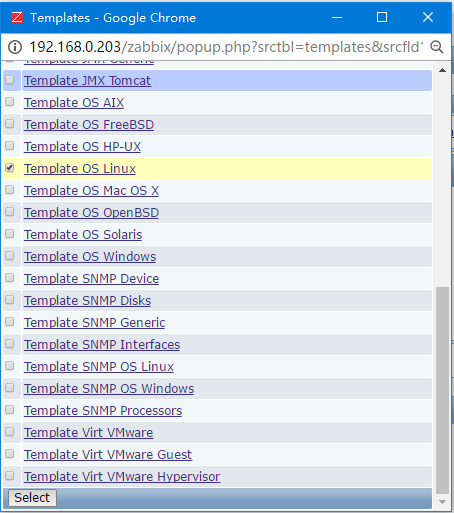
回到之前的页面,不过显示的好像不大好,也可以在输入框中进行输入
选择add添加
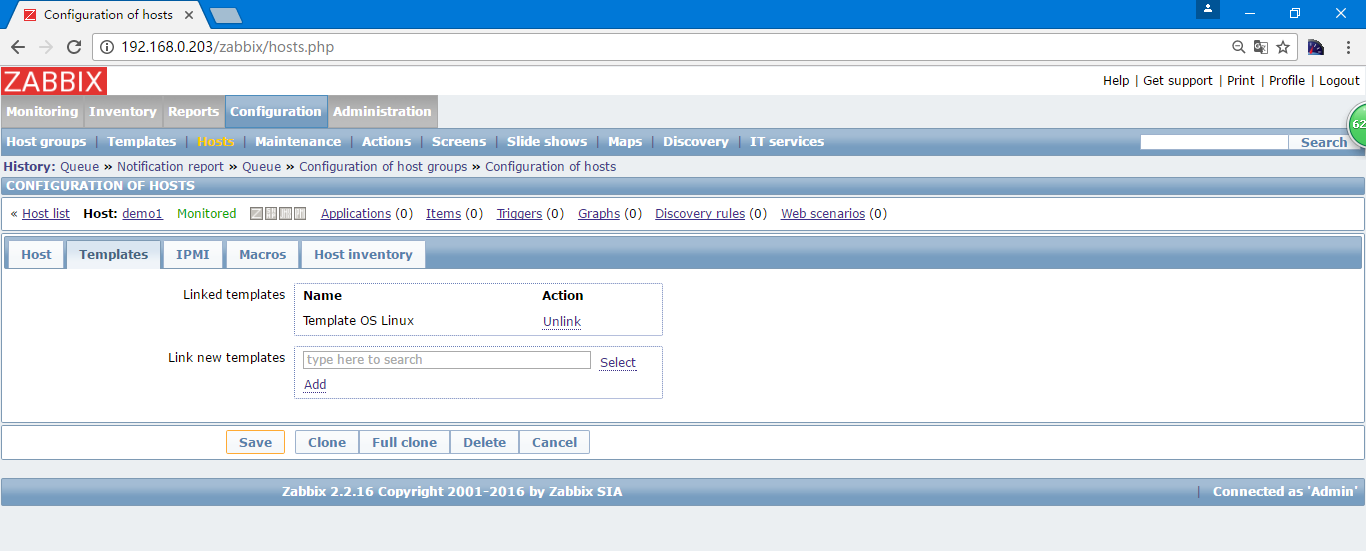
刚才的模板就添加成功
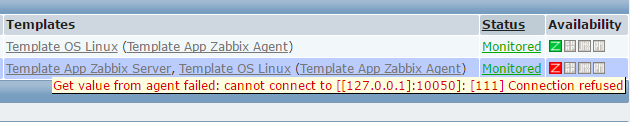
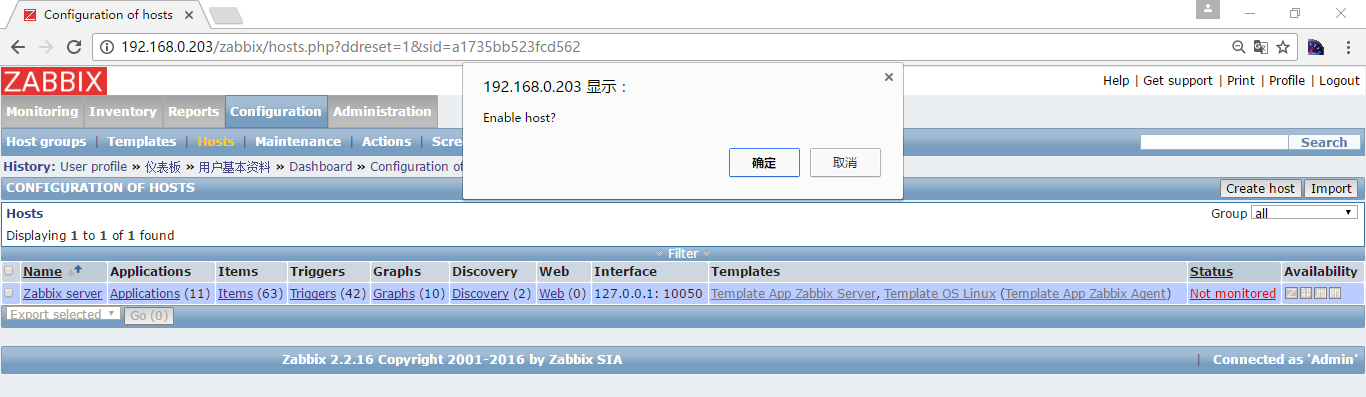
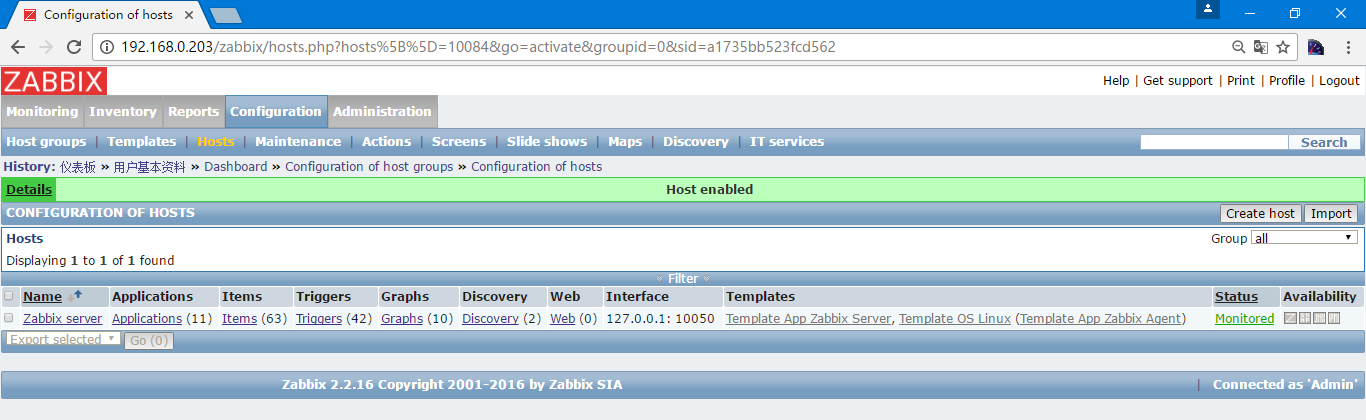
这个红色代表的是zabbix未能成功检测到被监控主机,这是因为我们服务没有启动
[root@heartbeat1 ~]# service zabbix-agentd start
Starting Zabbix agent:                                     [确定]
[root@heartbeat1 ~]# ss -nlput | grep 10050
tcp    LISTEN     0      128                   :::10050                :::*      users:(("zabbix_agentd",5550,5),("zabbix_agentd",5551,5),("zabbix_agentd",5552,5),("zabbix_agentd",5553,5),("zabbix_agentd",5554,5),("zabbix_agentd",5555,5))
tcp    LISTEN     0      128                    *:10050                 *:*      users:(("zabbix_agentd",5550,4),("zabbix_agentd",5551,4),("zabbix_agentd",5552,4),("zabbix_agentd",5553,4),("zabbix_agentd",5554,4),("zabbix_agentd",5555,4))
因为默认会监控所有ip,所以在zabbix-server上的主机用127.0.0.1也可以
dashboard中我们主要关注的是system status(系统状态),last 20 issues(最近20项问题)和host status(主机状态)
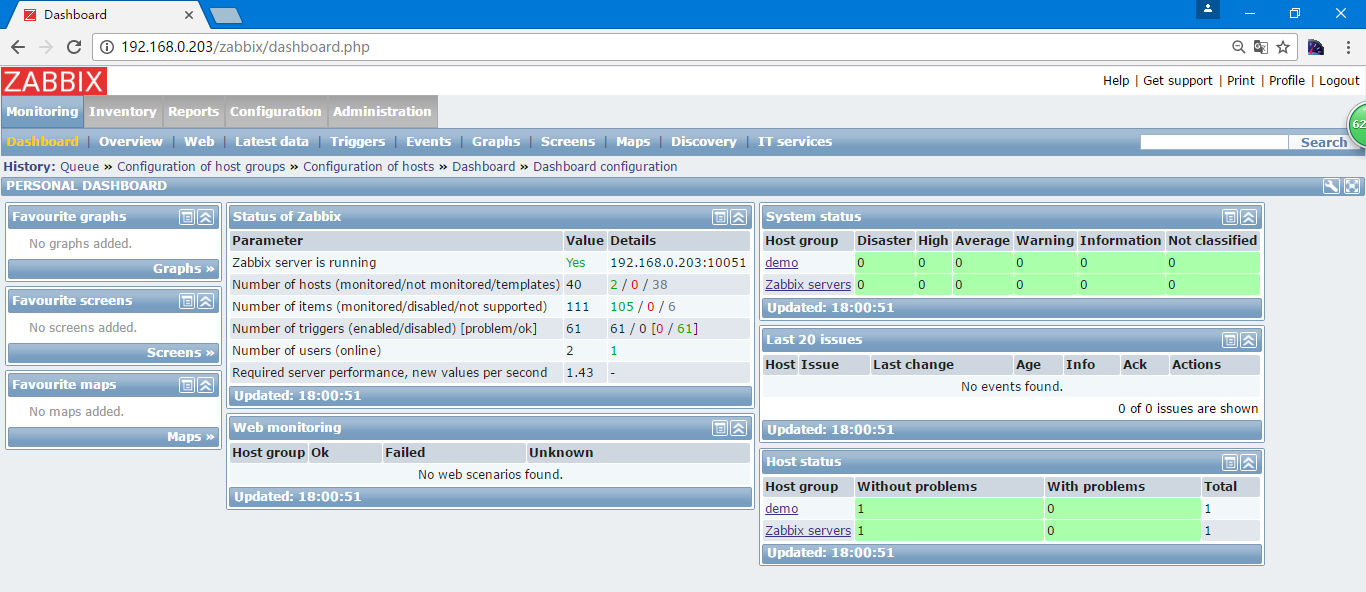
注意仪表盘是可以拖拽的
overview总览可以看到所有主机的状态,但是在主机数量多的情况下不推荐查看
lastdate最新数据,可以选择组和主机查看详细的状况
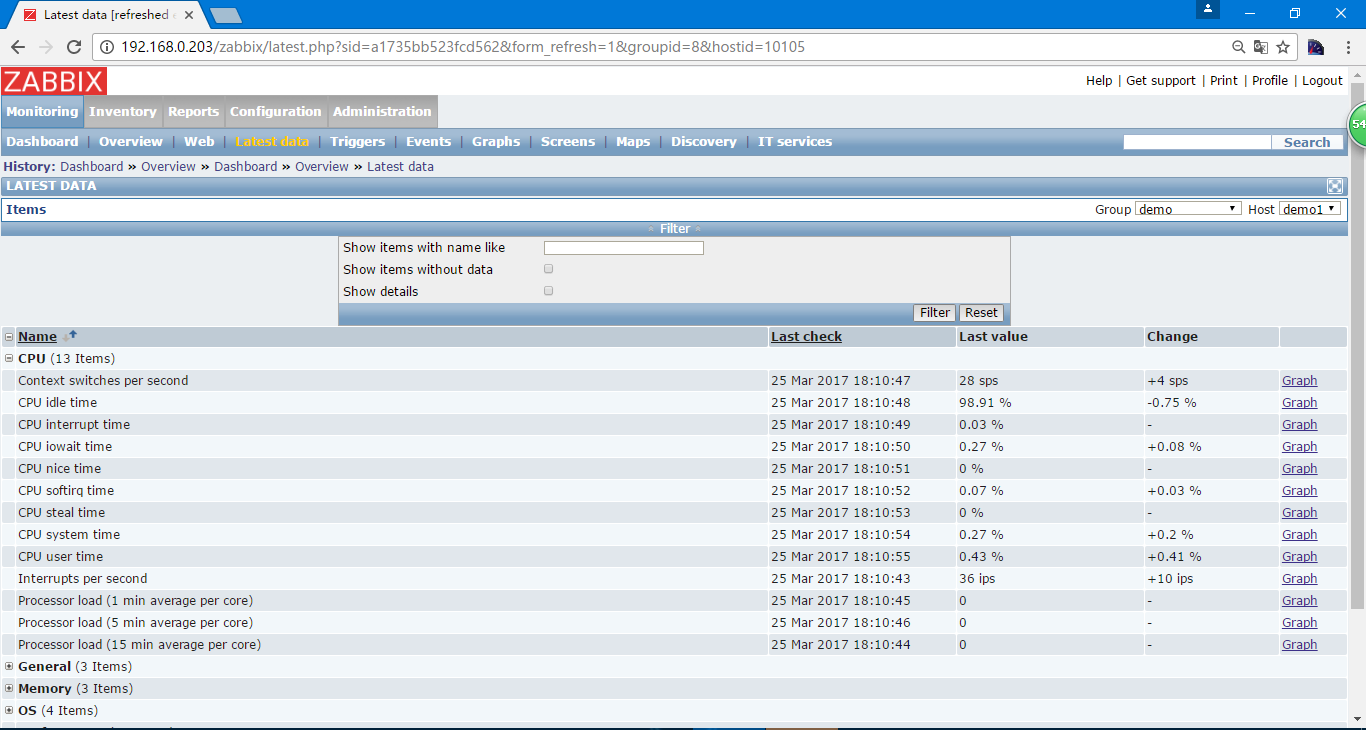
这写监控到的状态都是刚选择的模板监控到的
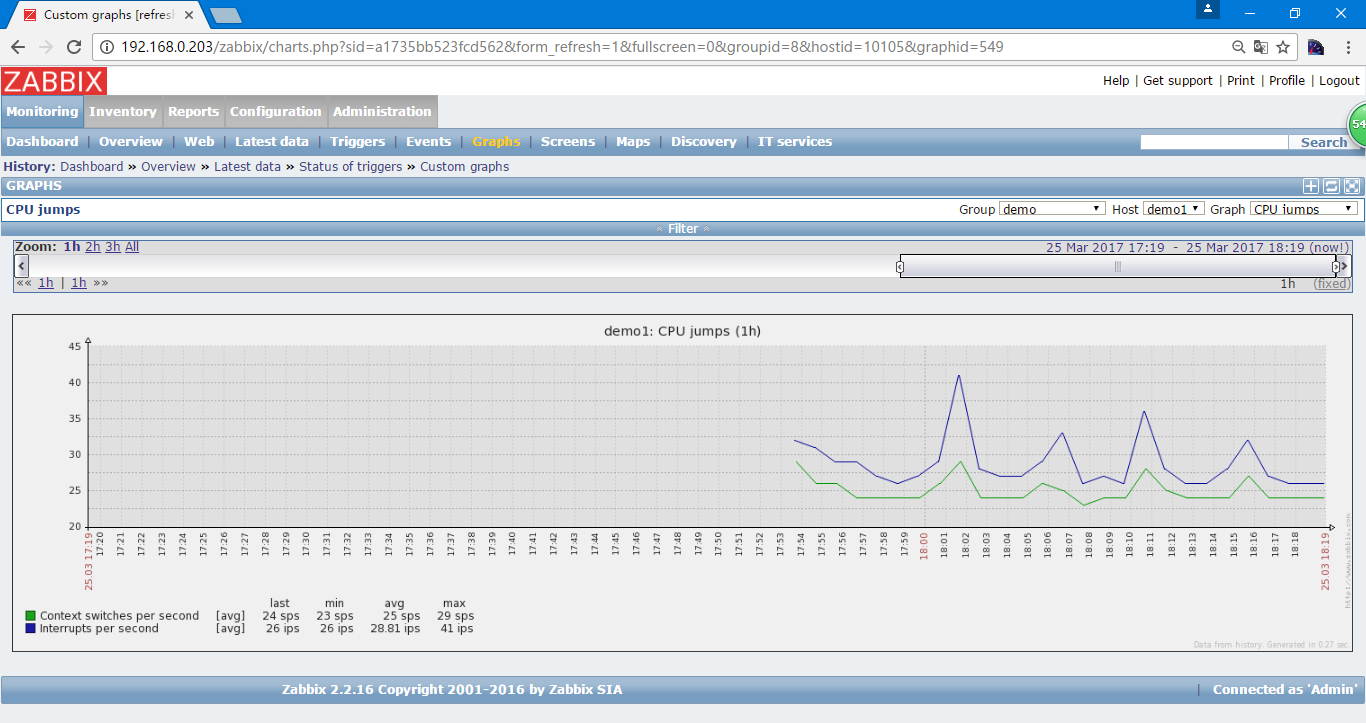
graph监控图像
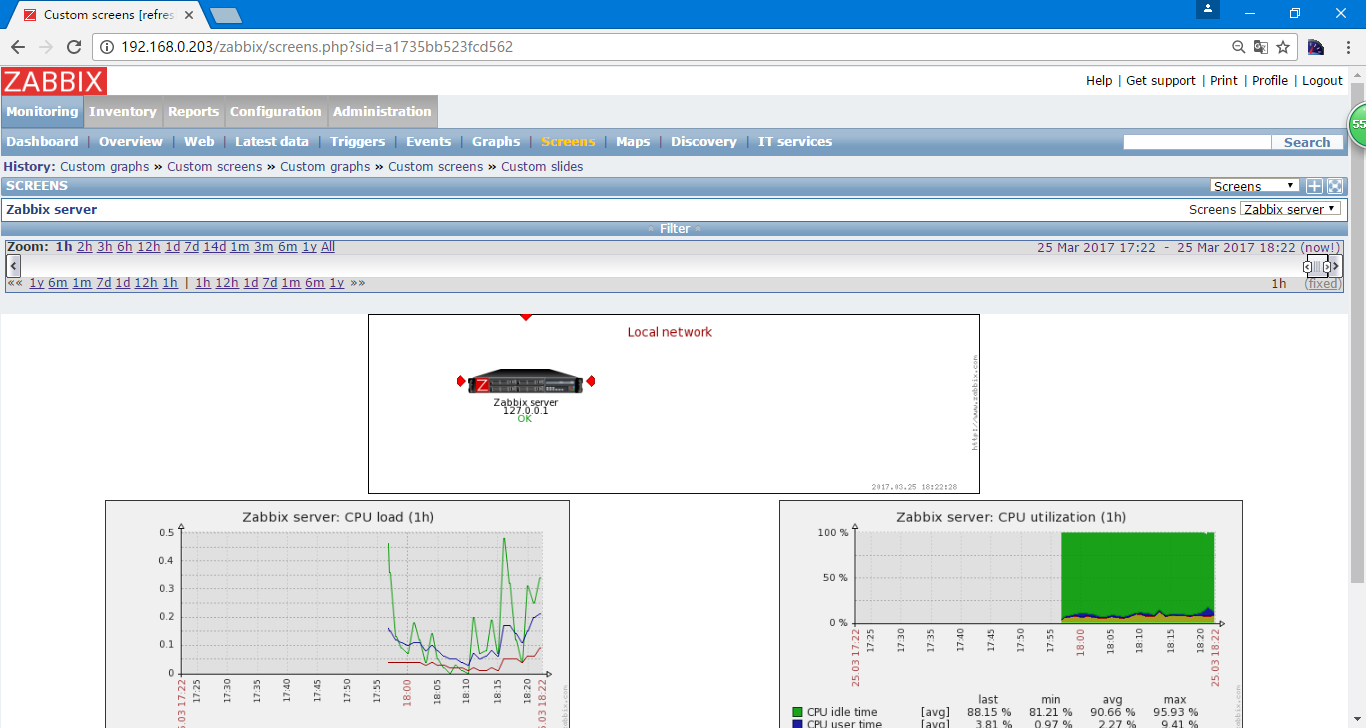
screen监控图像汇总
可以点击右上方的 添加到监控首页
监控首页
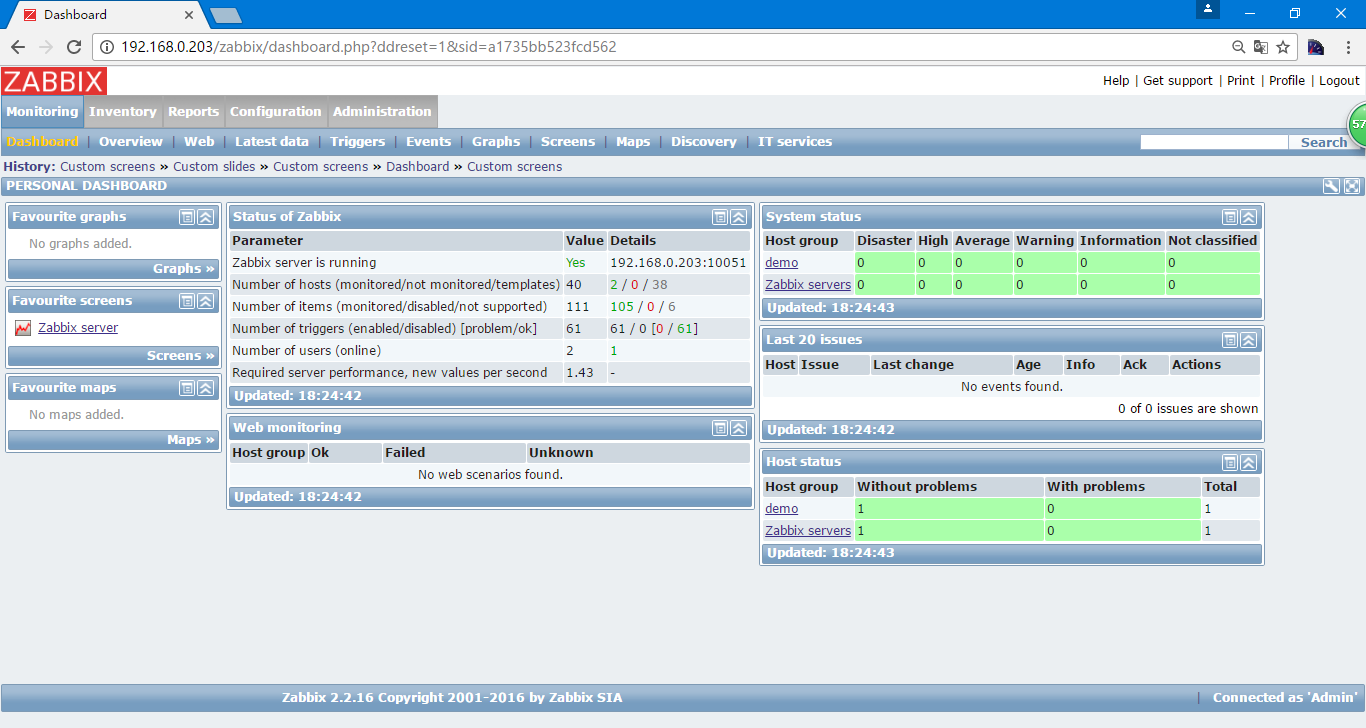
可以根据业务,添加数据库的监控,流量的监控等等
这个screen实在configuration中配置的
添加用户 在administration中user
Zabbix administrators为zabbix的root组,可以从右侧选择从user group选为user
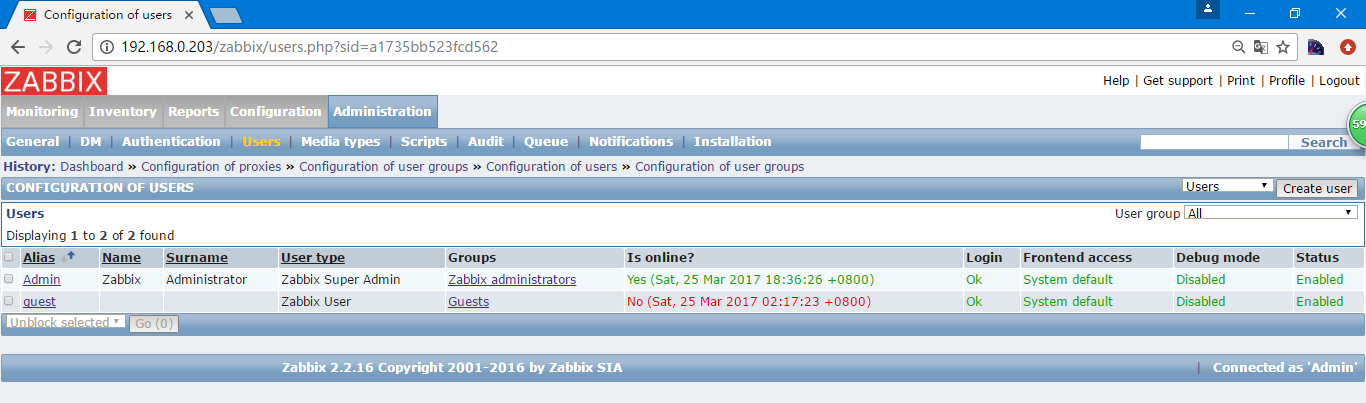
选择create user创建用户
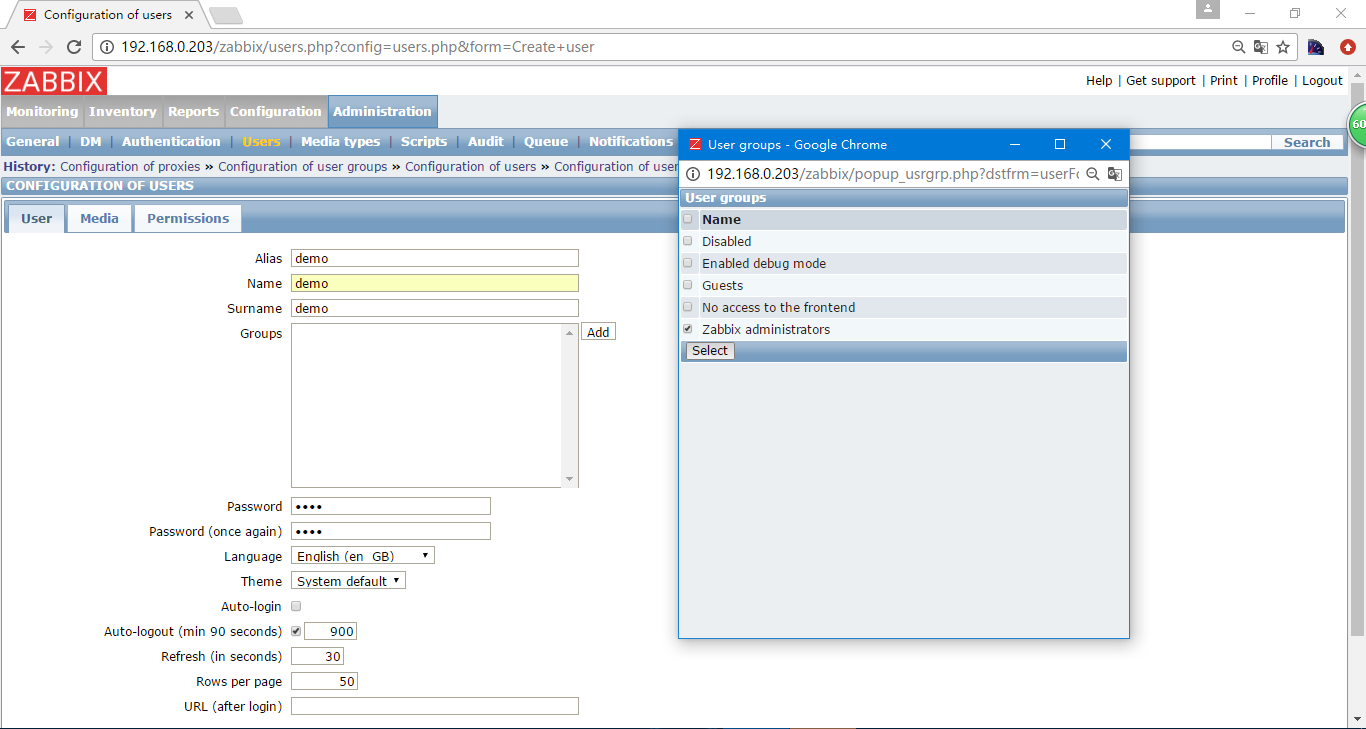
一定要给用户添加群组 添加报警的media
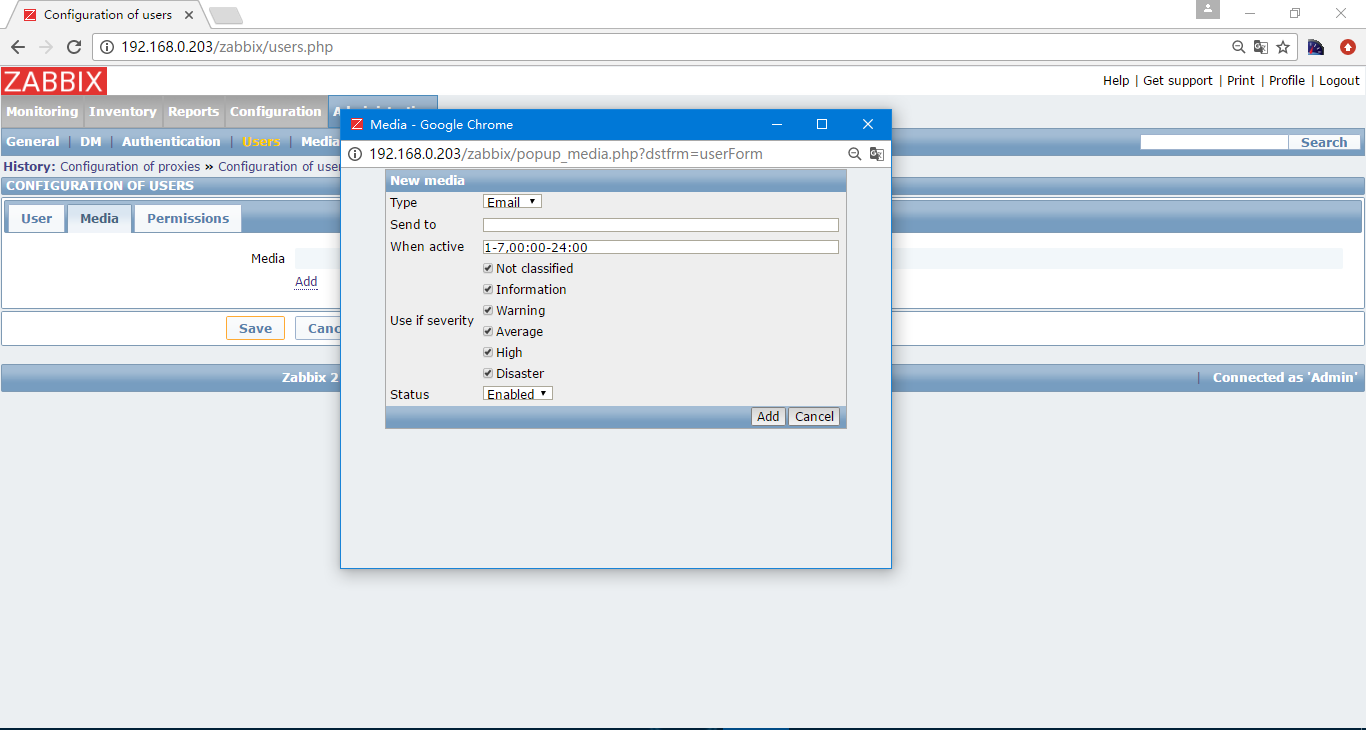
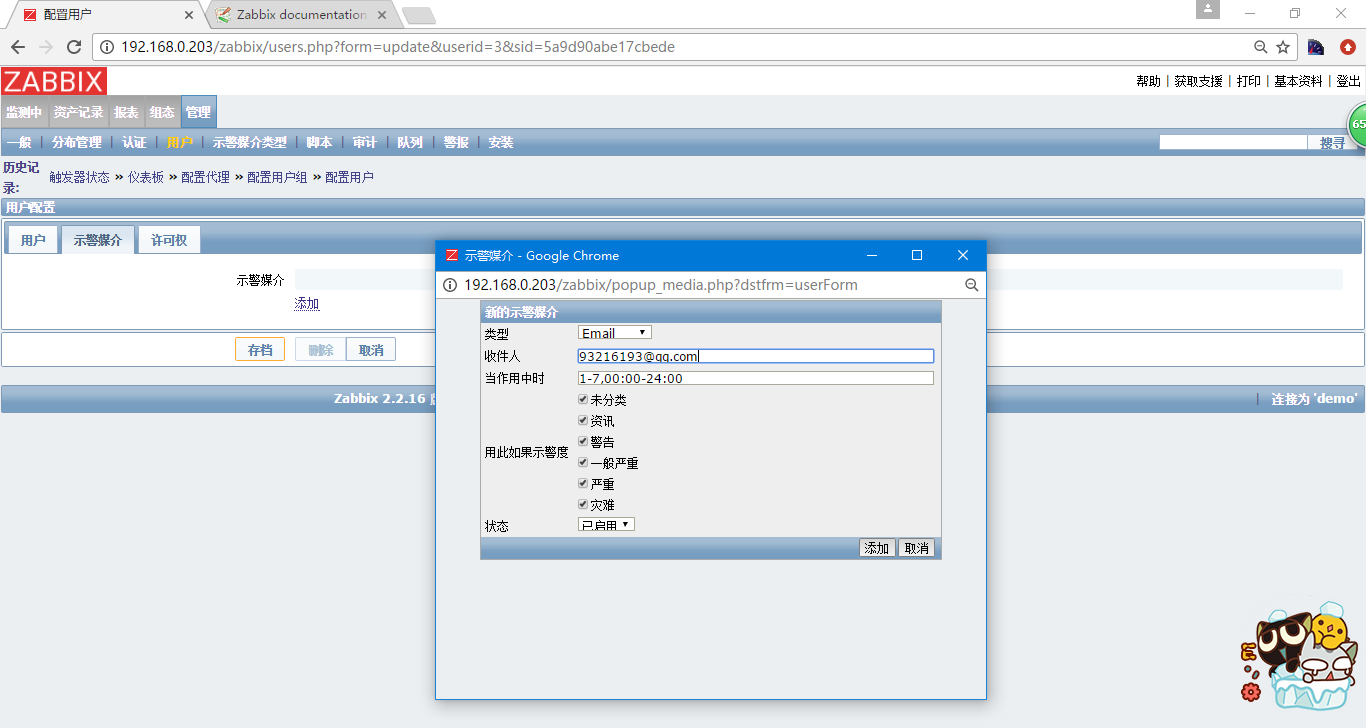
1-7,00:00-24:00代表周一到周天,全天报警,并且对虽有级别进行报警,如果是给领导的用户最好就周一到周五,上班时间,只接收Disastar级别即可 用户的权限
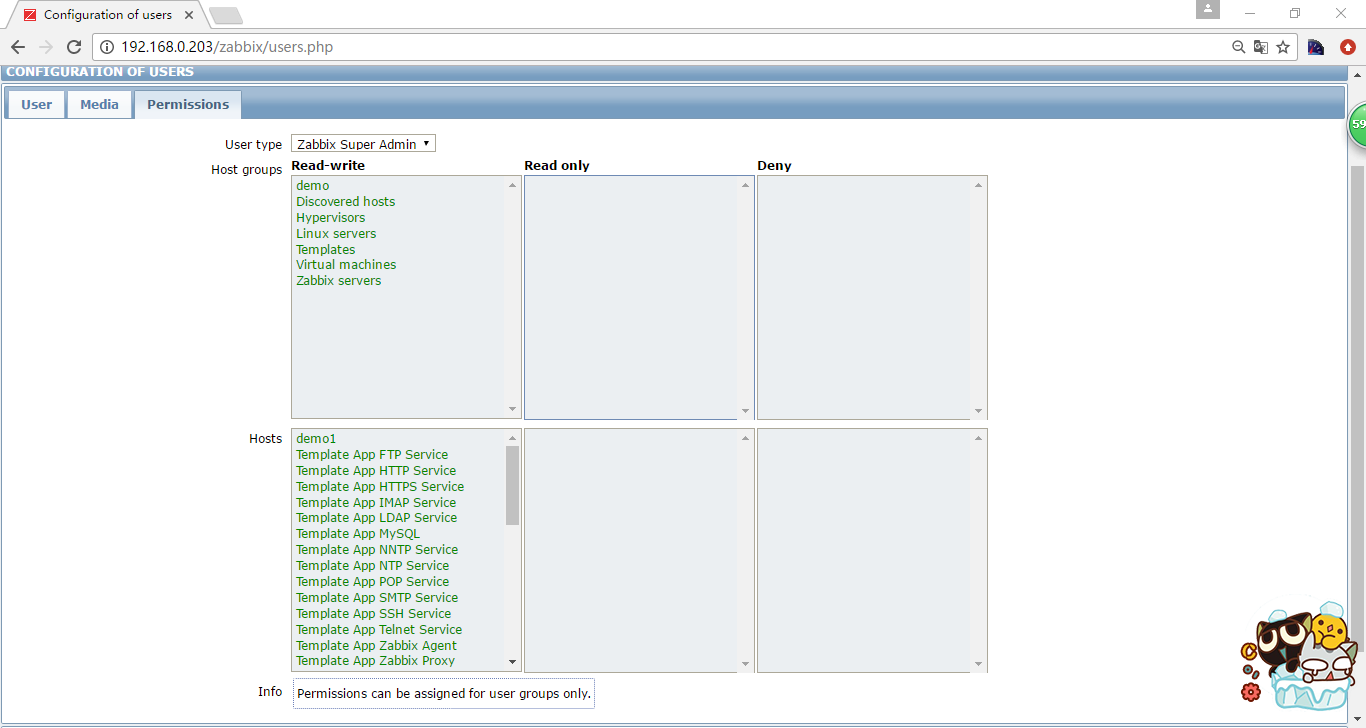
注意用户的权限只能通过用户组设定,无法单独为一个用户设定
保存即可
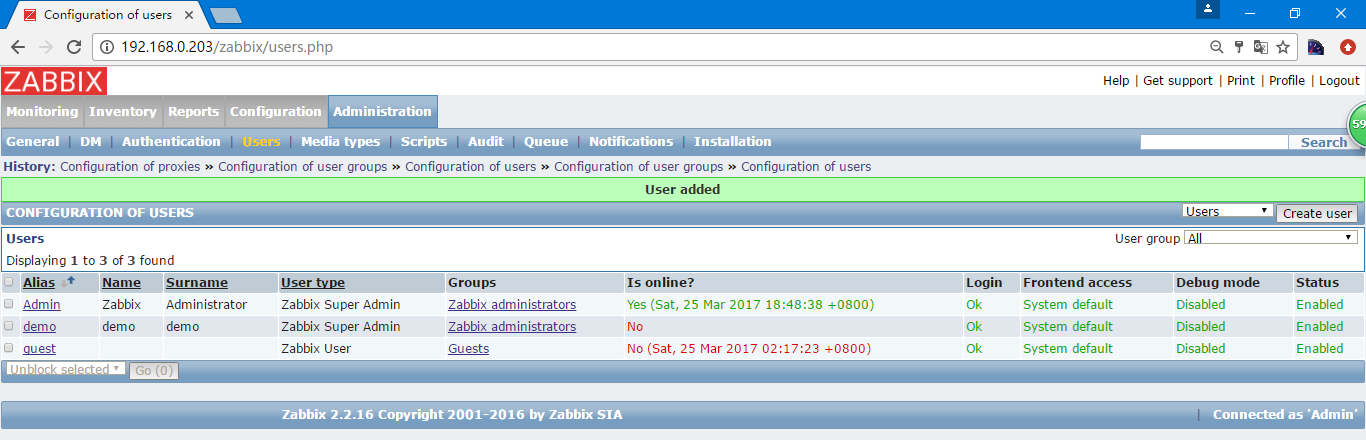
然后退出后使用刚创建的用户进行登录
监控项
[root@heartbeat2 ~]# mysqladmin -uroot -p123456 ping
mysqld is alive
[root@heartbeat2 ~]# mysqladmin -uroot -p123456 ping | grep -c alive
1
修改zabbixx_agentd.conf
[root@heartbeat2 ~]# vi /etc/zabbix/zabbix_agentd.conf


### Option: UserParameter
#       User-defined parameter to monitor. There can be several user-defined parameters.
#       Format: UserParameter=<key>,<shell command>
#       See 'zabbix_agentd' directory for examples.
#
# Mandatory: no
# Default:
# UserParameter=
UserParameter= mysql_alive,mysqladmin -uroot -p123456 ping | grep -c alive
重启agentd
[root@heartbeat2 ~]# service zabbix-agentd restart
Shutting down Zabbix agent:                                [确定]
Starting Zabbix agent:                                     [确定]
在server端检测
[root@heartbeat1 ~]# zabbix_get -s 192.168.0.130 -k mysql_alive
1
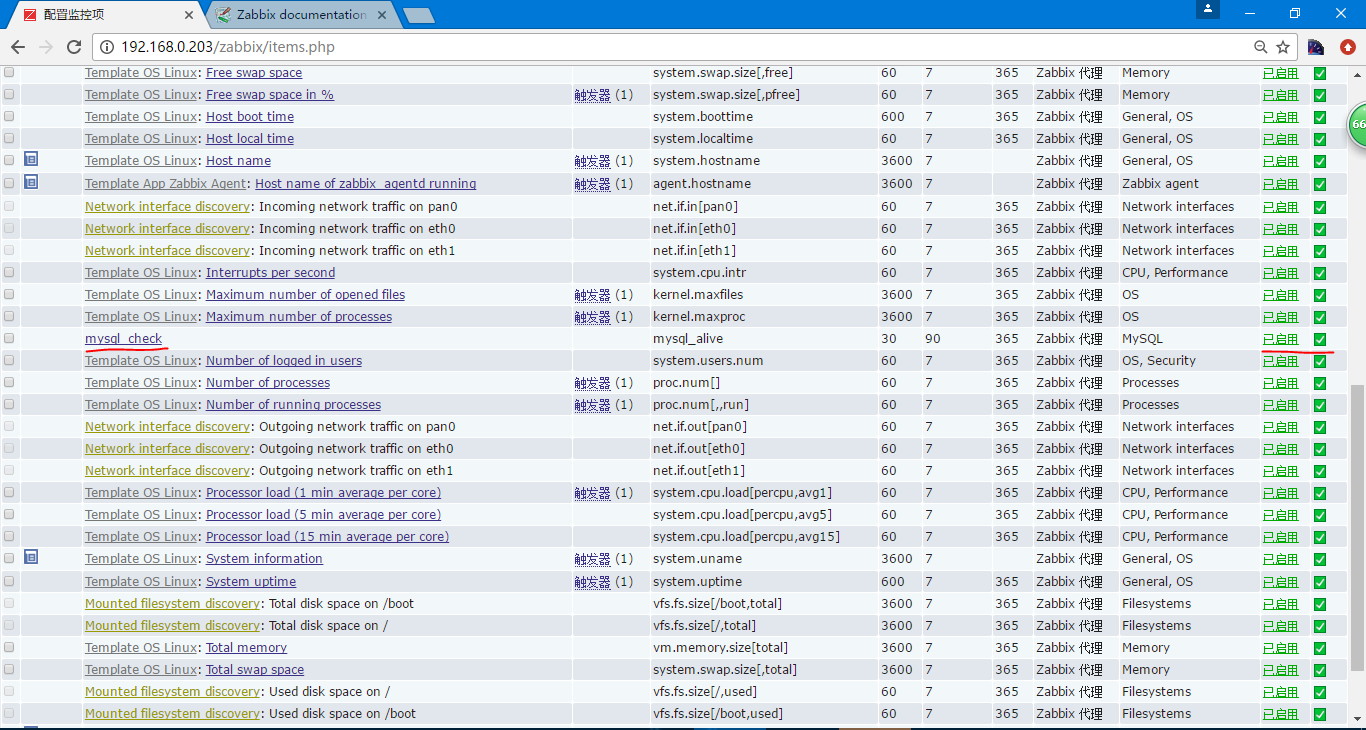
添加监控项,选择主机中的监控项
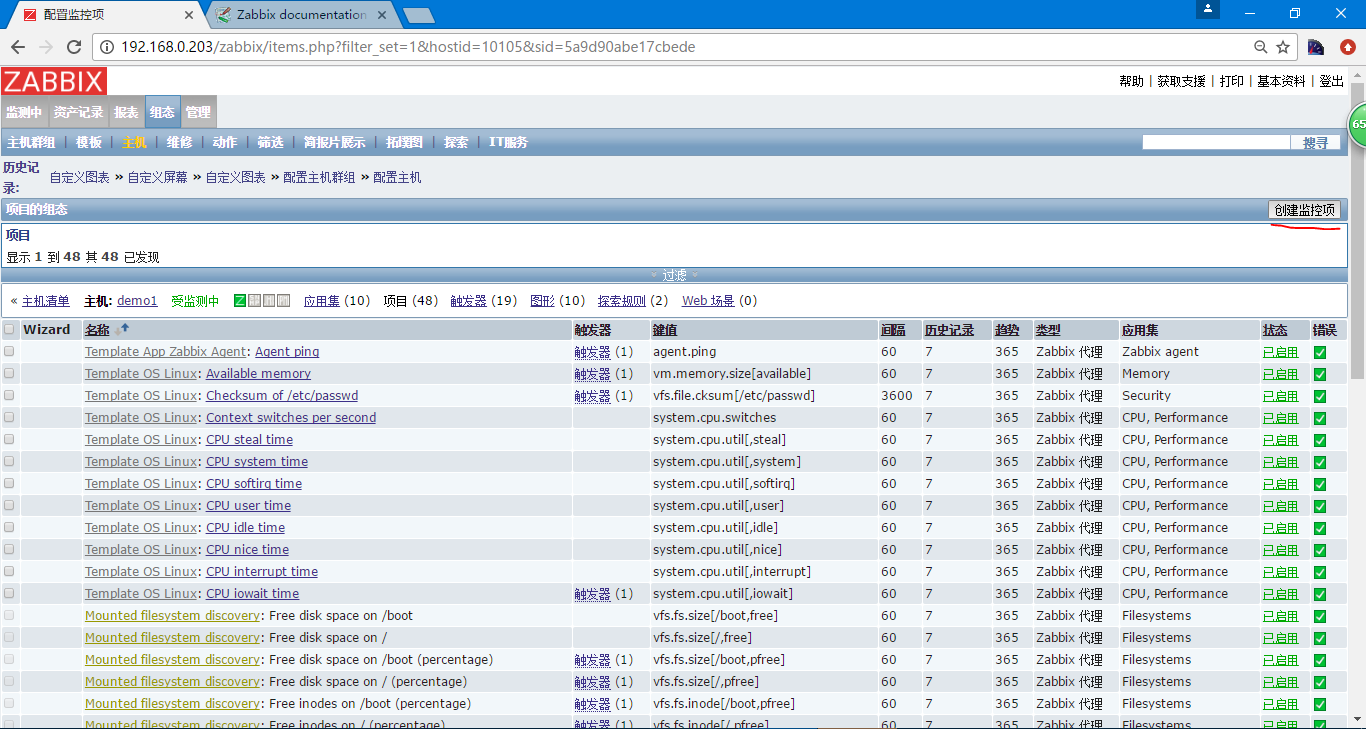
创建监控项
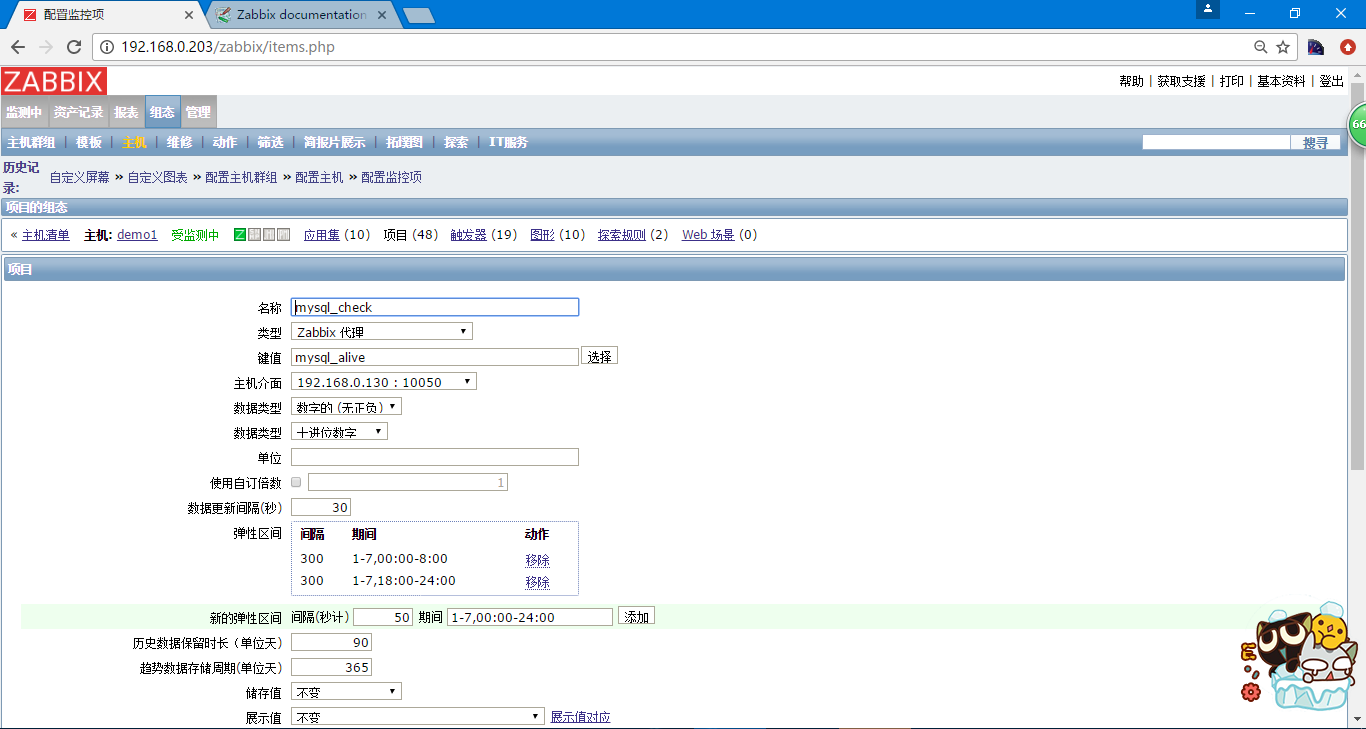
- 监控项的名称mysql_check
- 监控项的键值,在选择中并没有,需要自行添加
- 数据更新的间隔,可以设置默认值,然后在添加其他的规则,比如在不同时间段监控的时间间隔不同
- 历史数据的保留情况,趋势图的保留情况
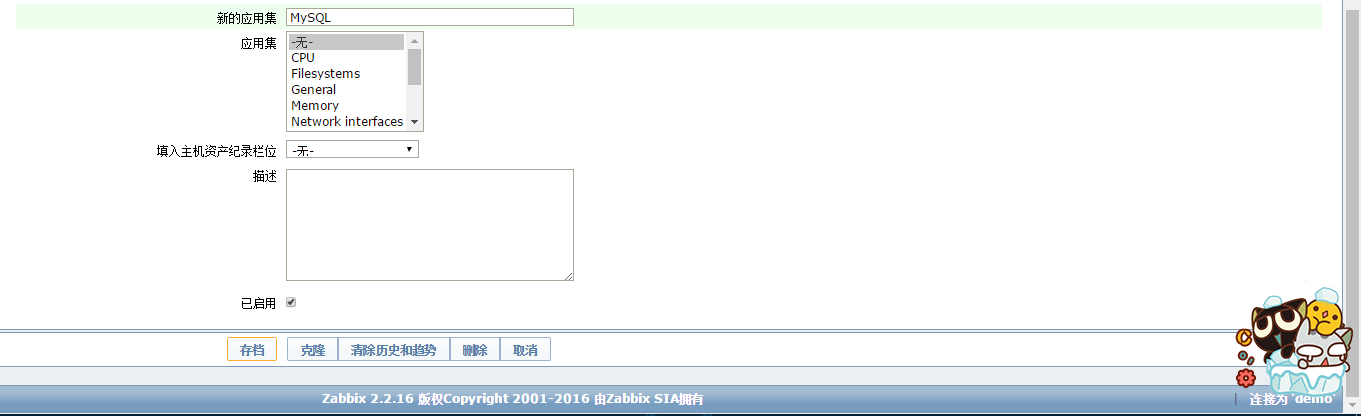
- 应用集可以自定义,也可以新建一个应用集
保存后可以在监控集中看到新添的监控项,并且是已启用的状态
然后为其创建对应的报警触发器
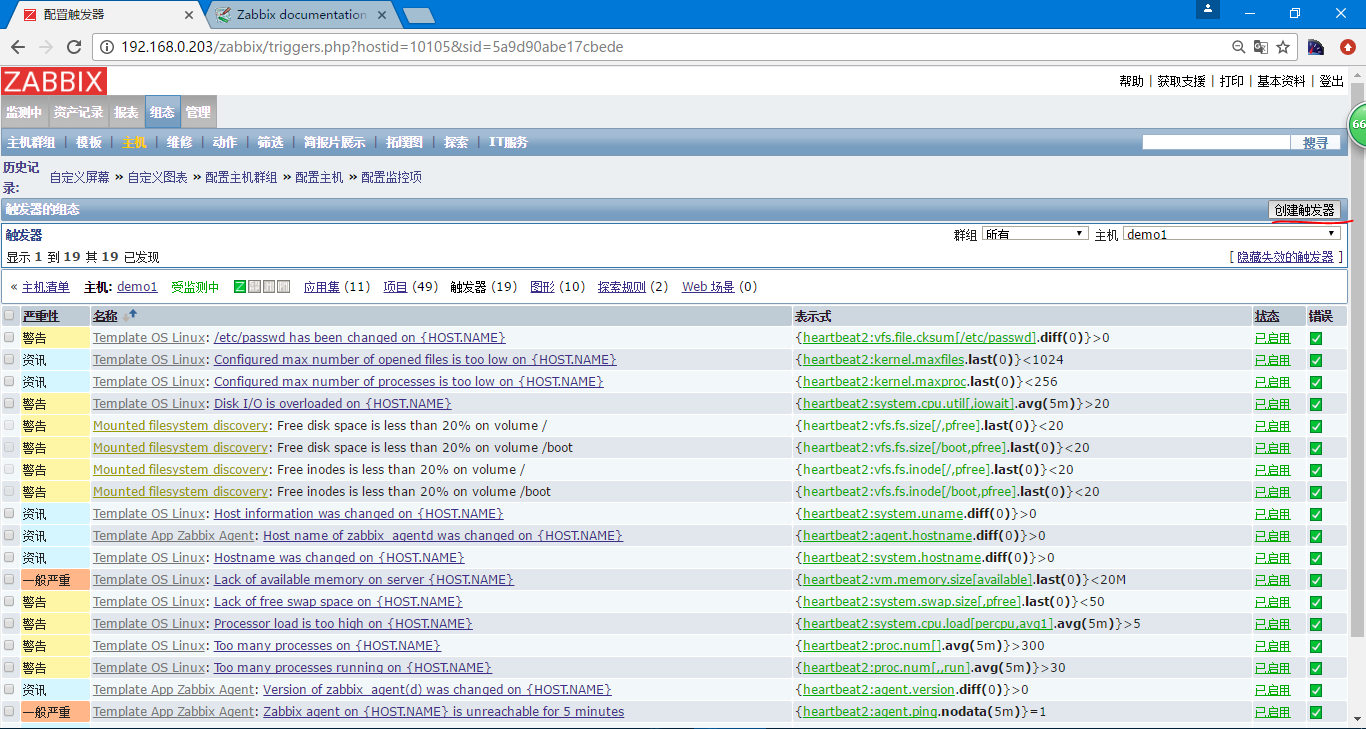
创建触发器,填入名称,选择报警级别和表达式
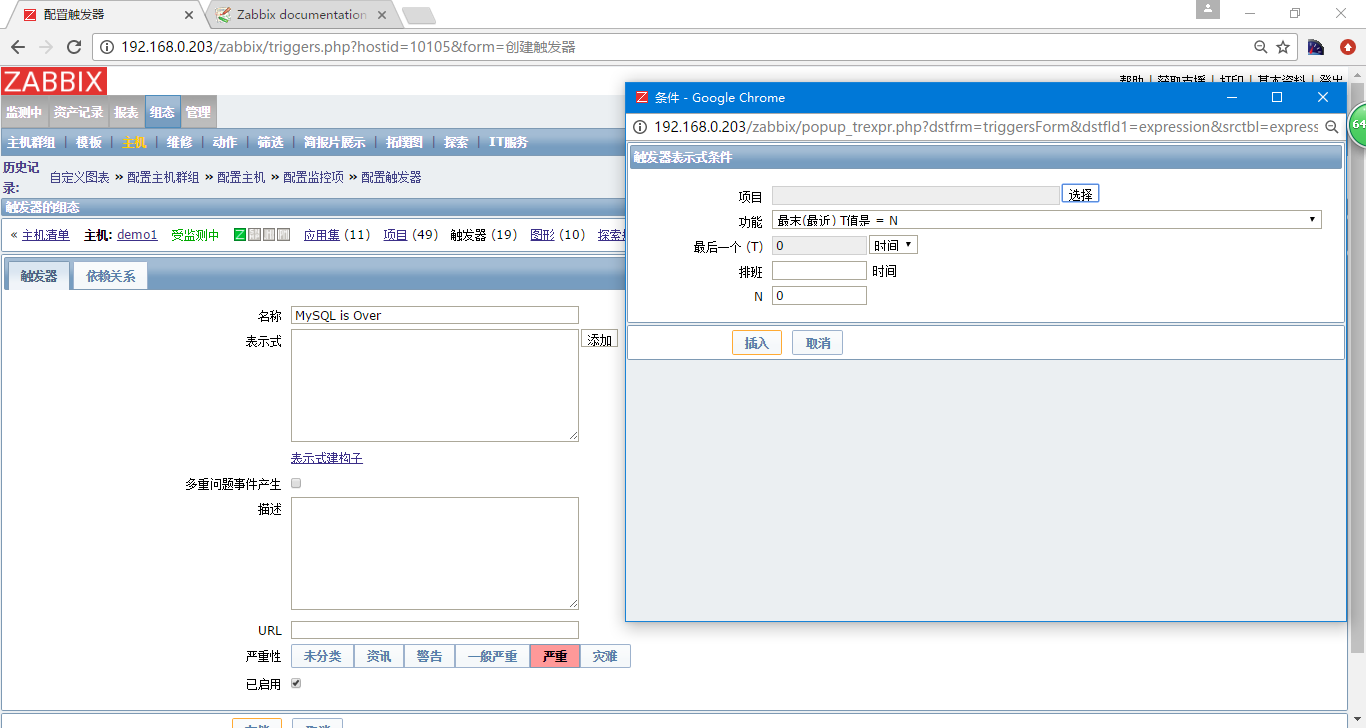
表达式的话是可以通过选择来实现,选择监控的项目
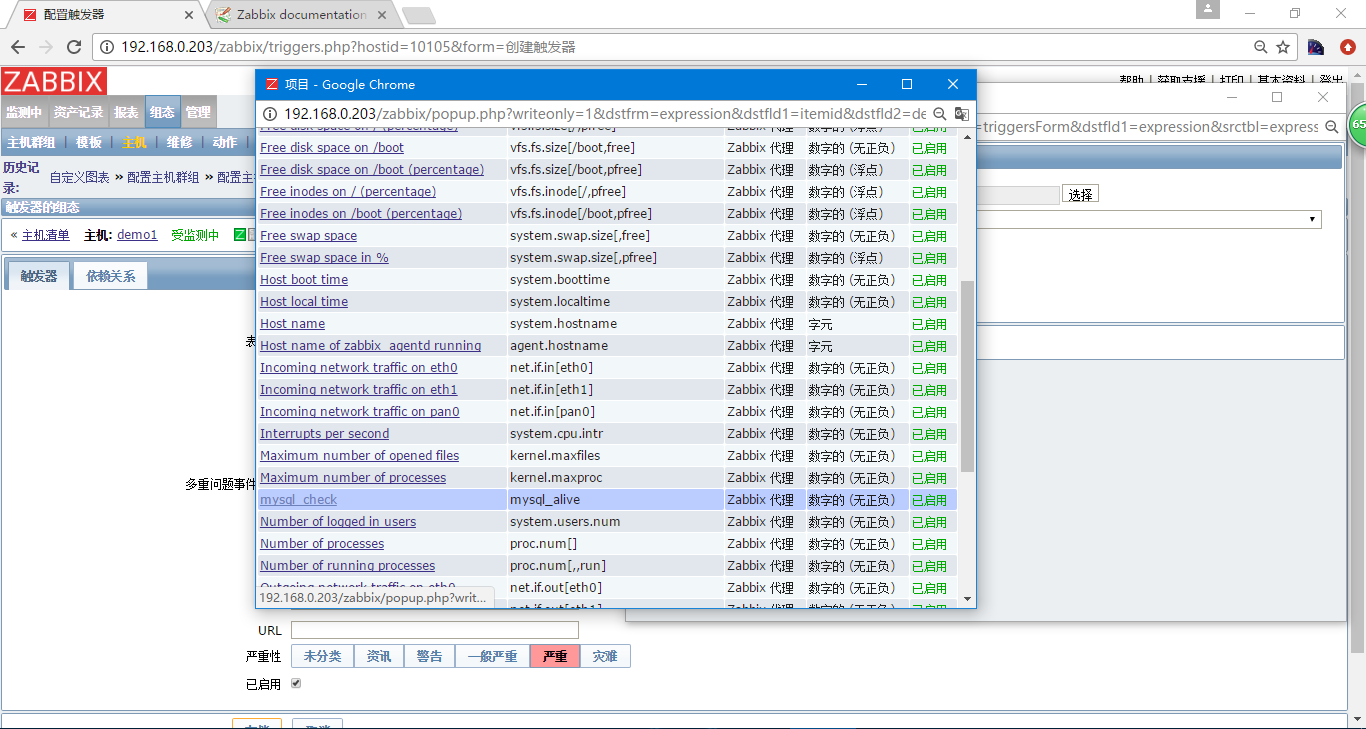
选着合适的表达式,对应的会是一个一个的函数
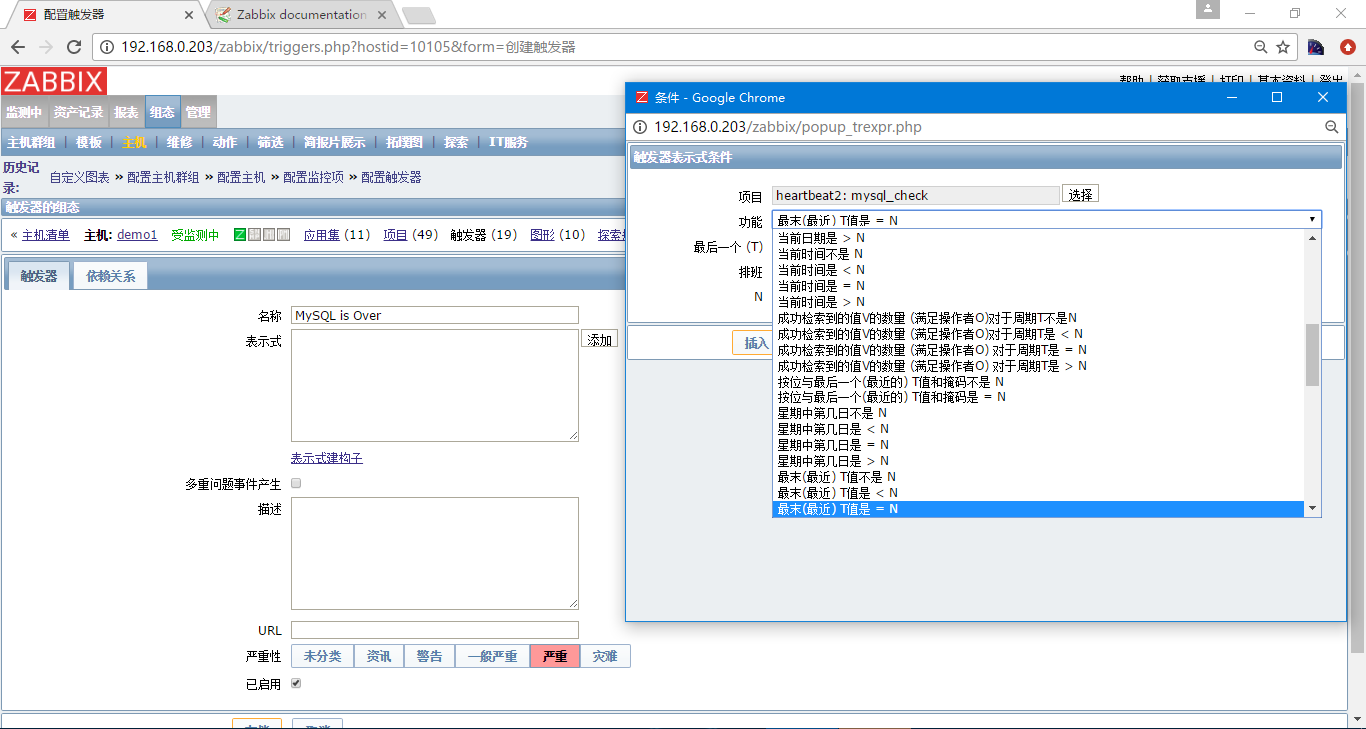
当前的值N自然就是刚才我们检测过的1
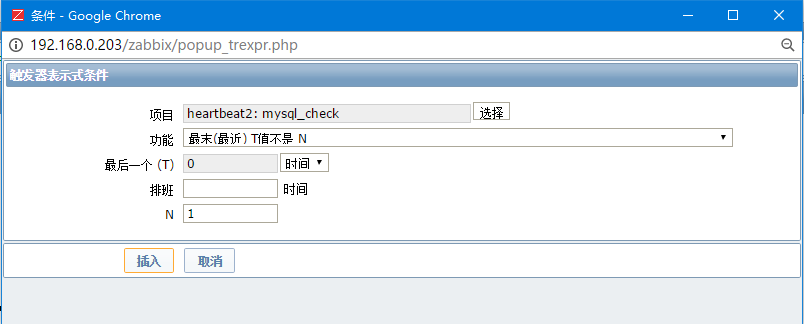
选择完后会在表达式中多一个表达式,进行保存即可,也可以设置依赖的条件
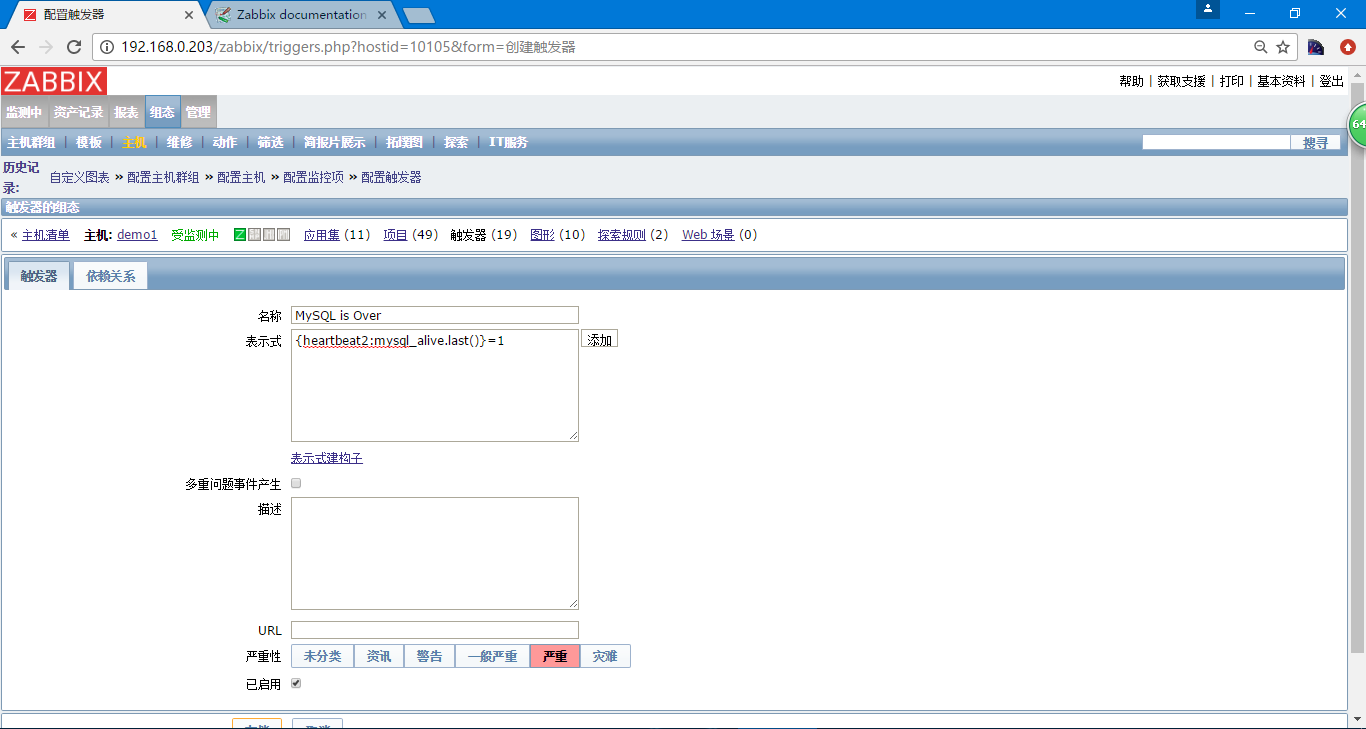
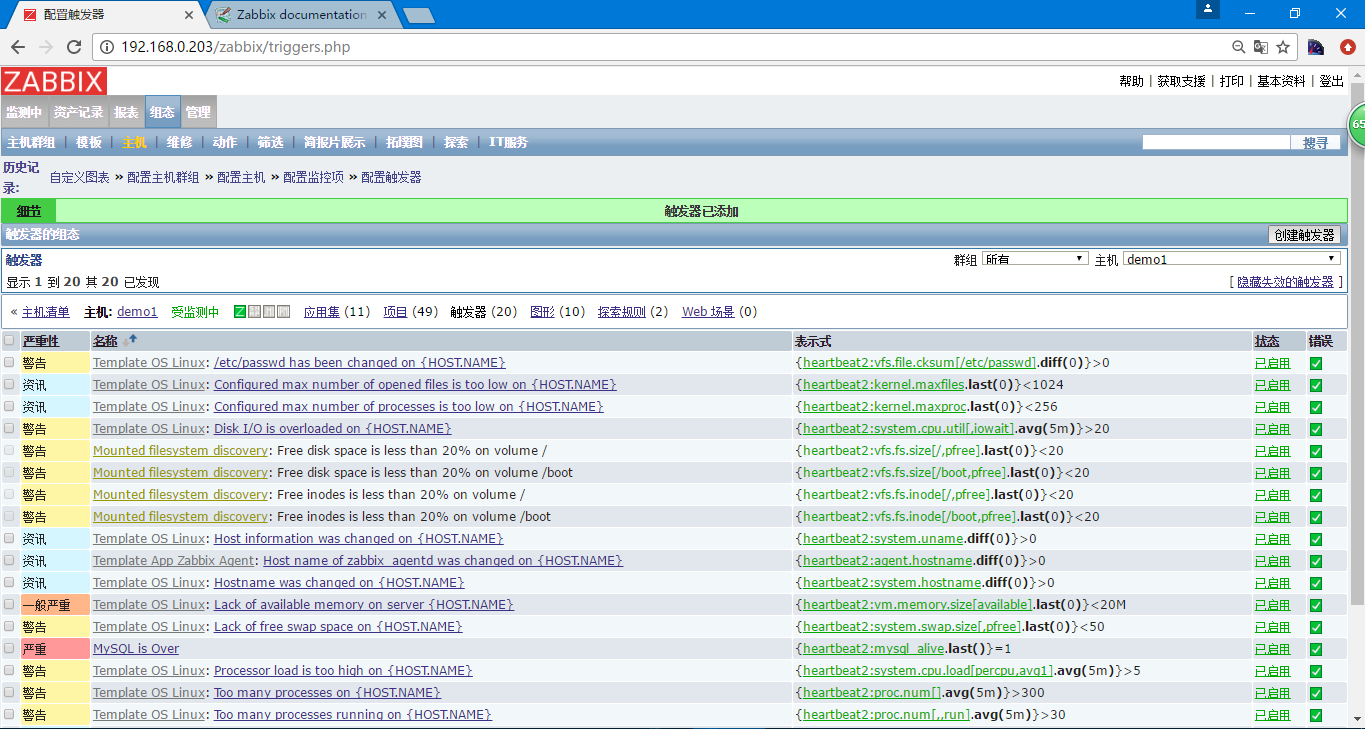
可以看到刚刚添加的触发器
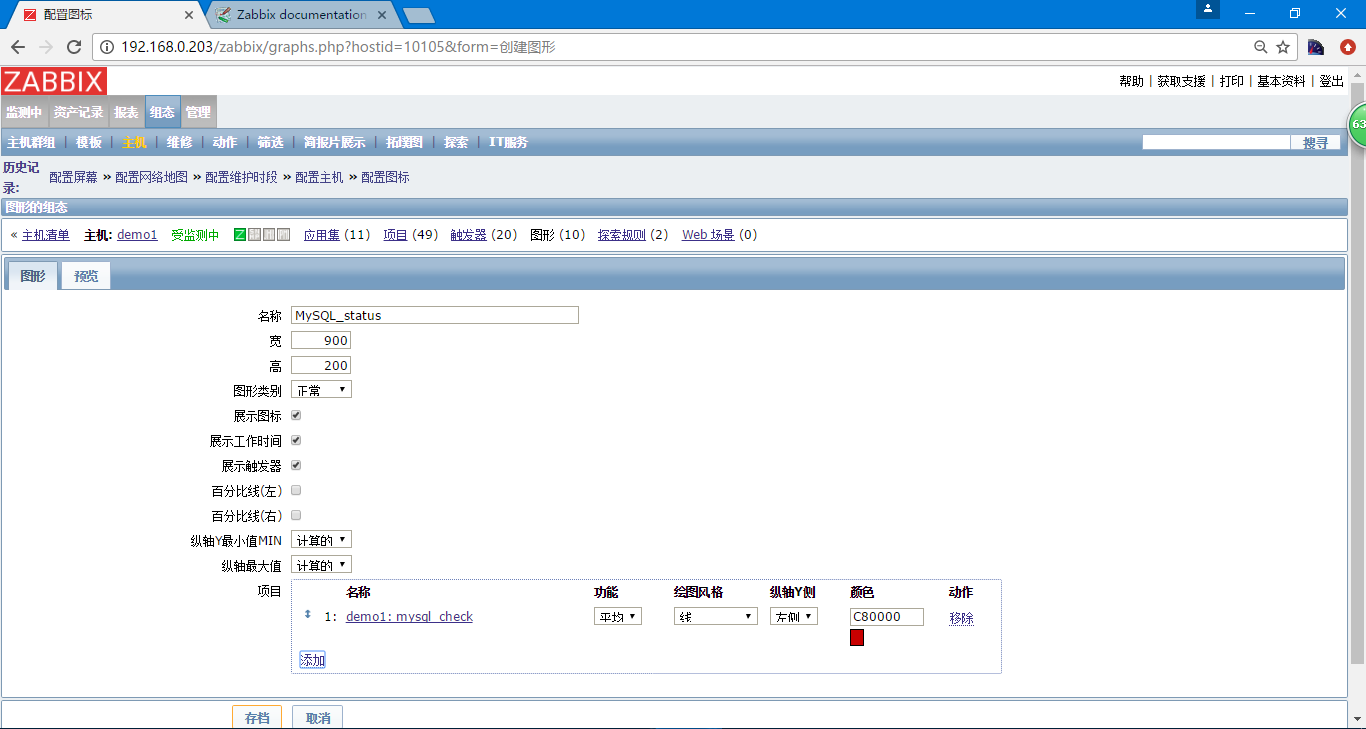
添加一个画图,选图画
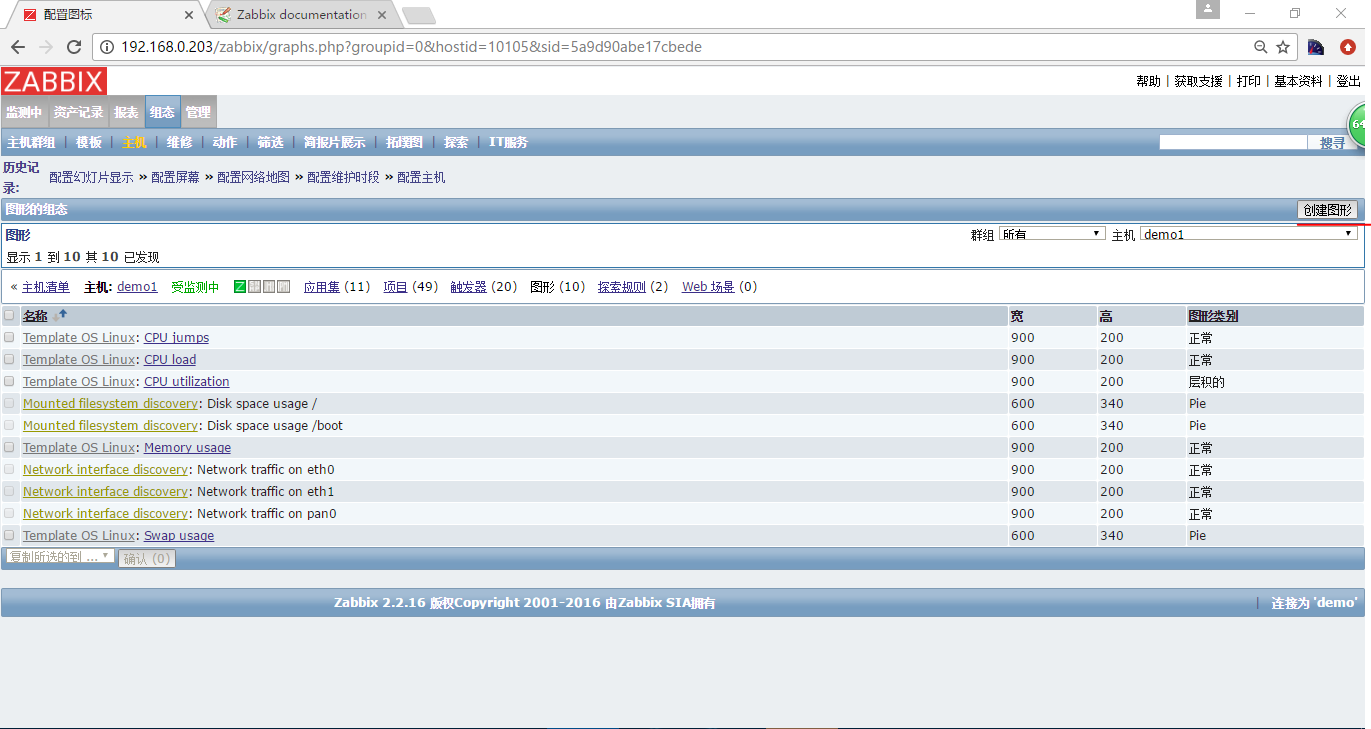
选创建图形,项目还是选择刚才添加的监控项
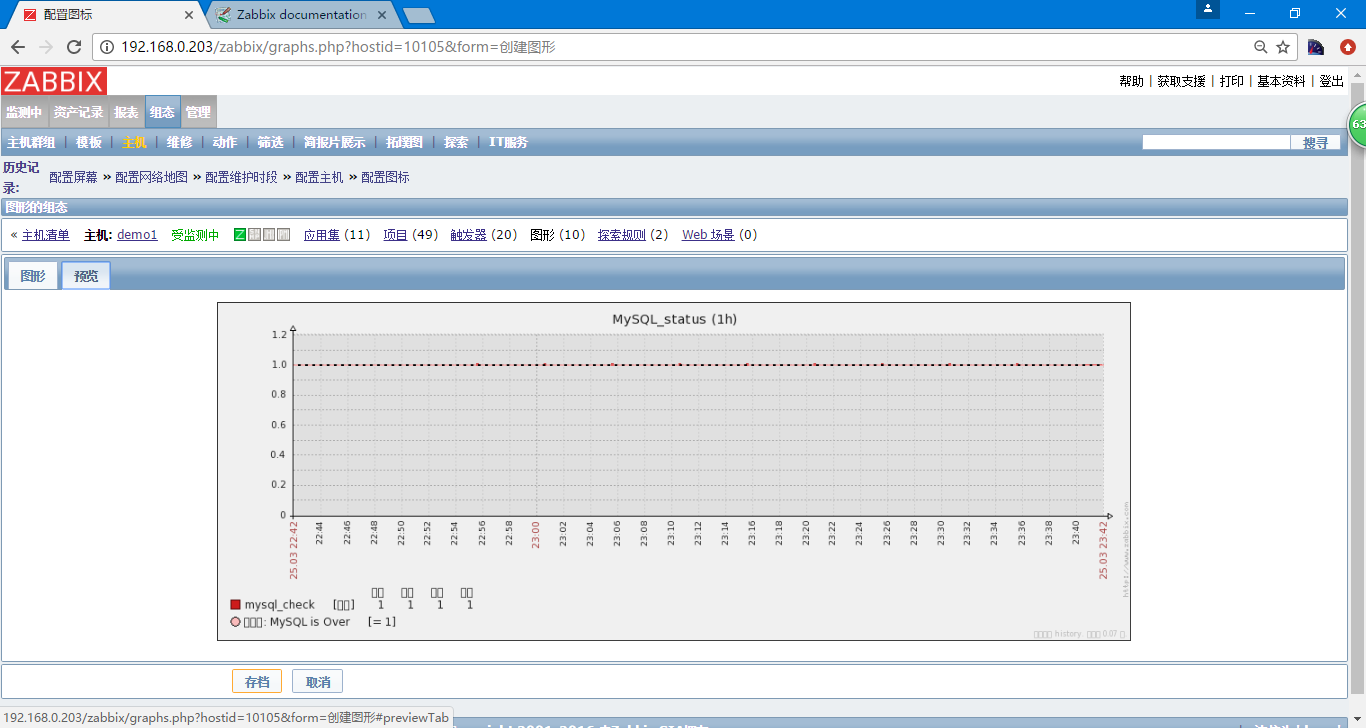
可以通过预览的形式看一下
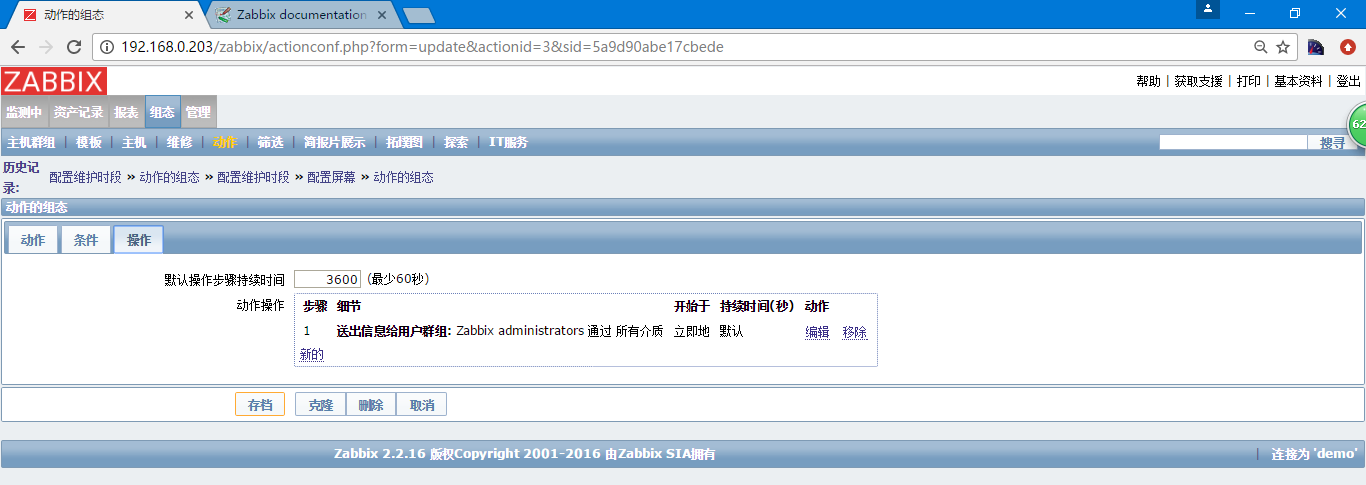
添加设置报警动作
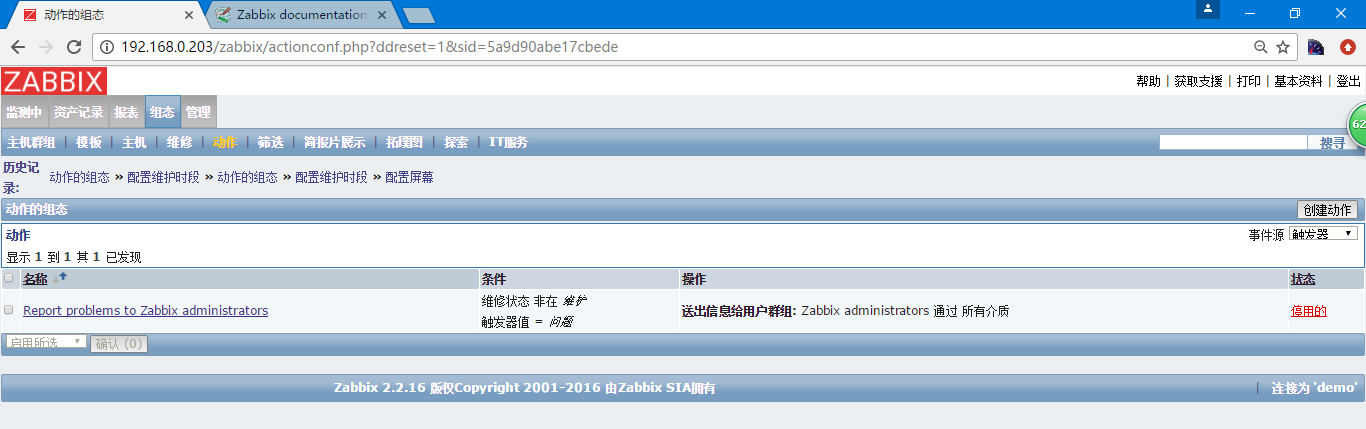
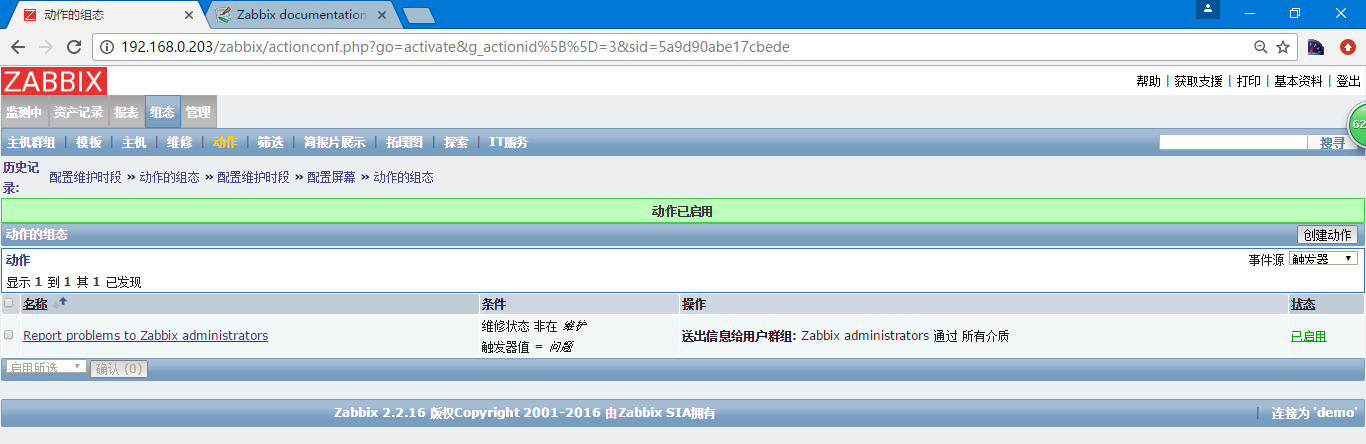
默认为未启动,需要启动一下
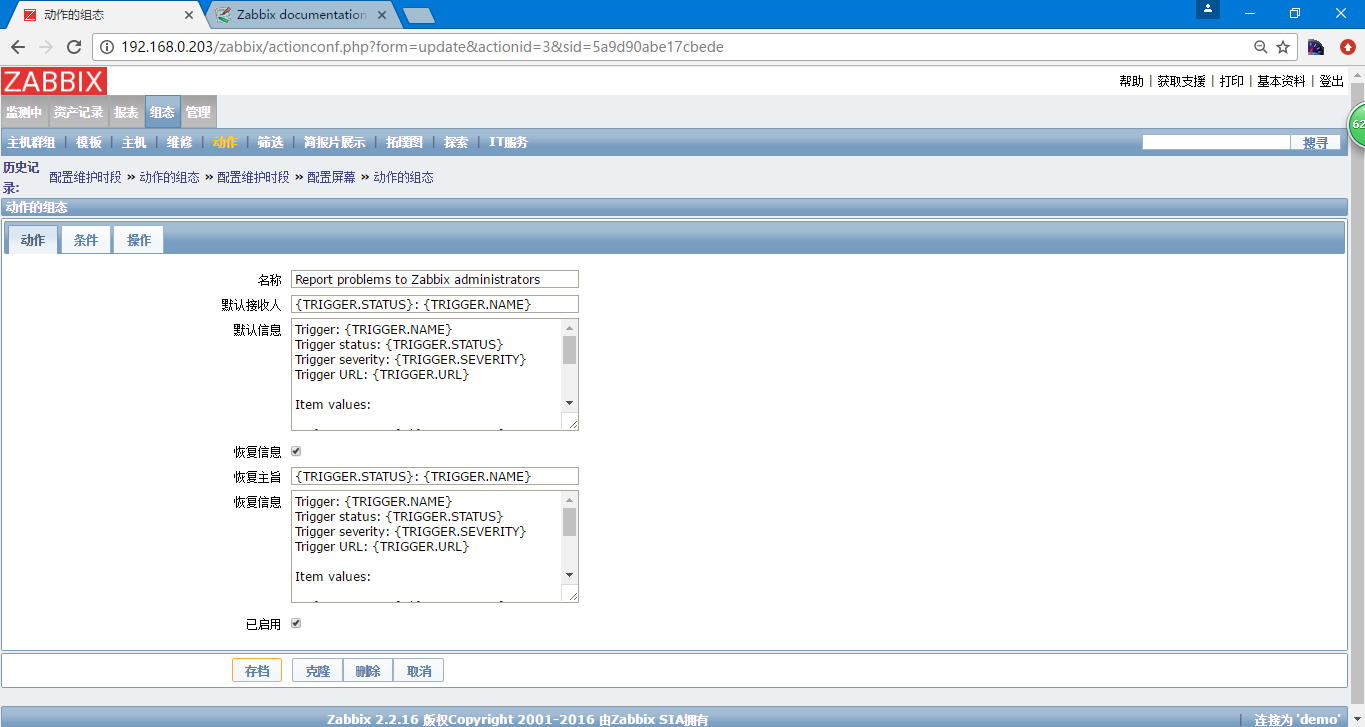
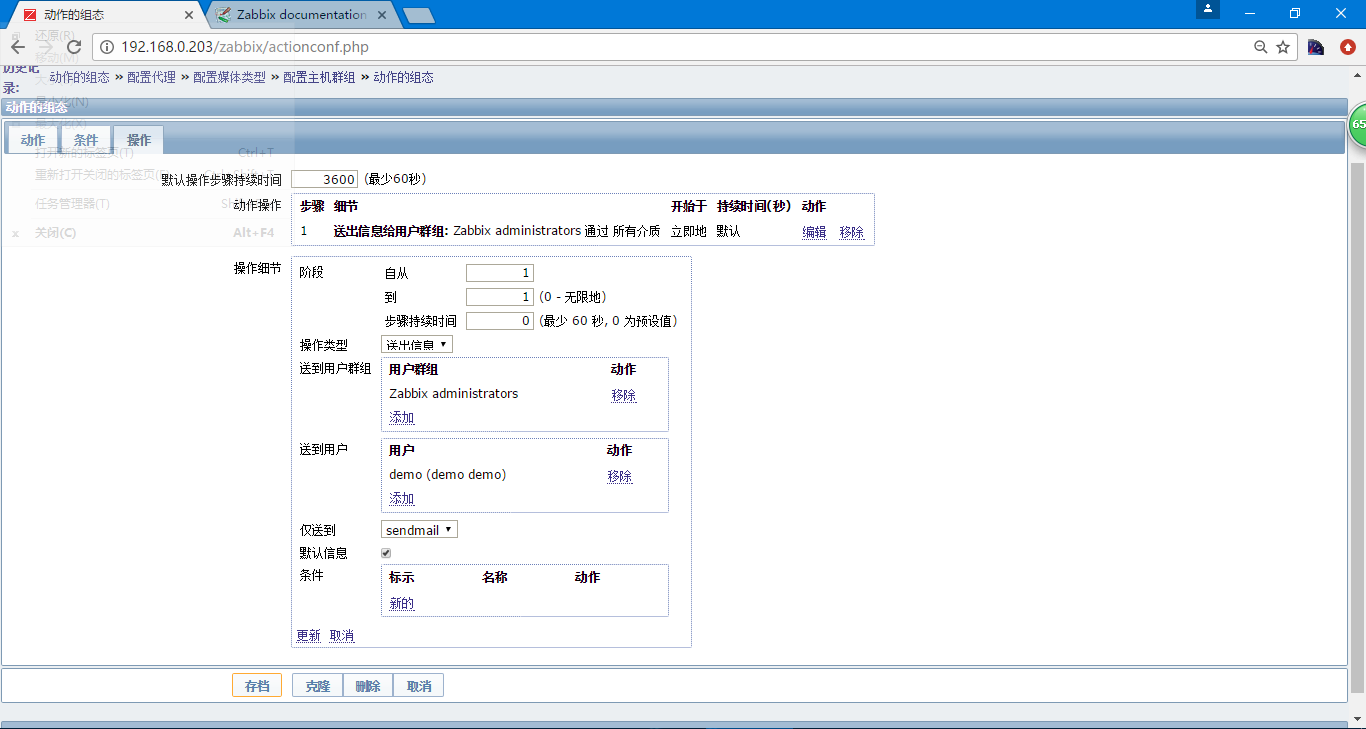
点进去进行配置,需要发送的信息
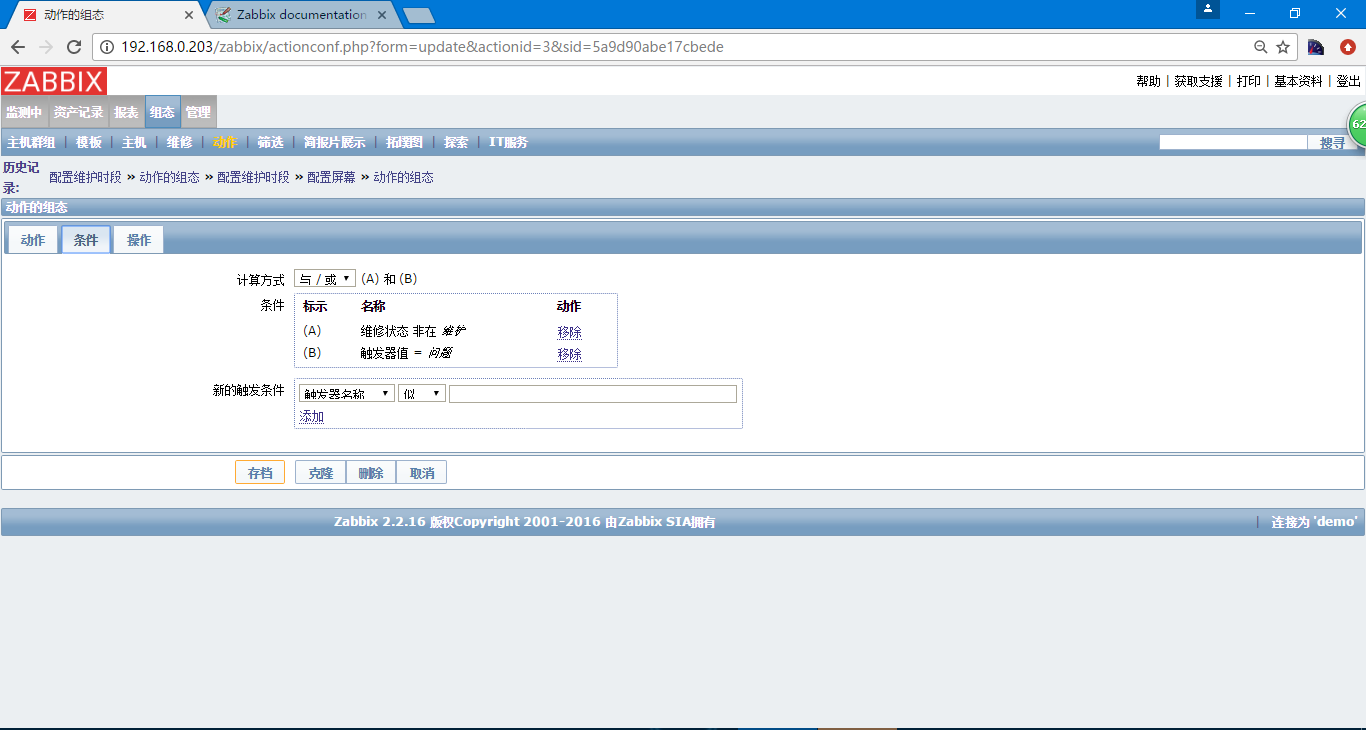
报警触发的条件
报警时的操作
可以进行编辑操作内容,这个暂时先不选择报警类型,下边新建一个报警类型
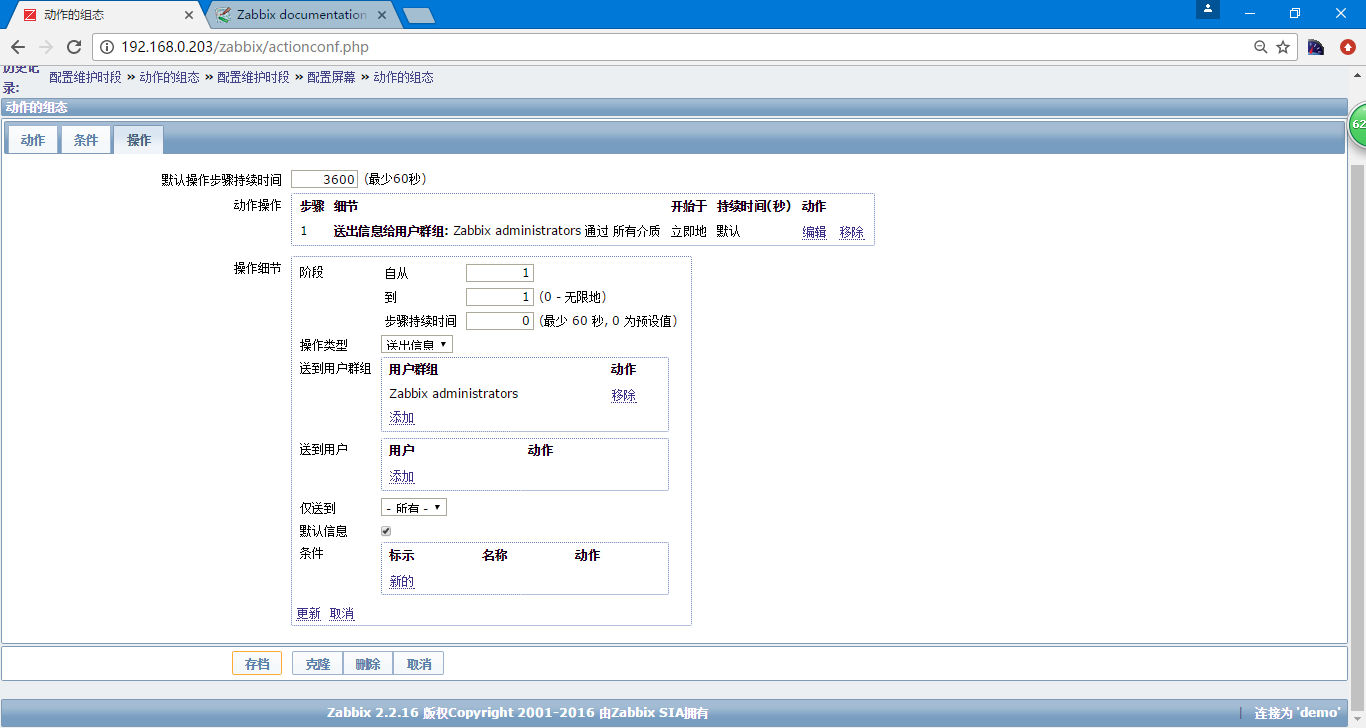
from 1 to 1代表从报警的第一次发送警报,到报警的第一次,也就是只发一次,如果to为10,就代表从第一次报警到第十次报警,发送10次消息,只要这个问题没解决,也可以是从报警的第第三次才开始发送消息等等,需要注意的是,这个内容要单独保存,选择更新,对应的英文为update,然后再进行保存
报警类型
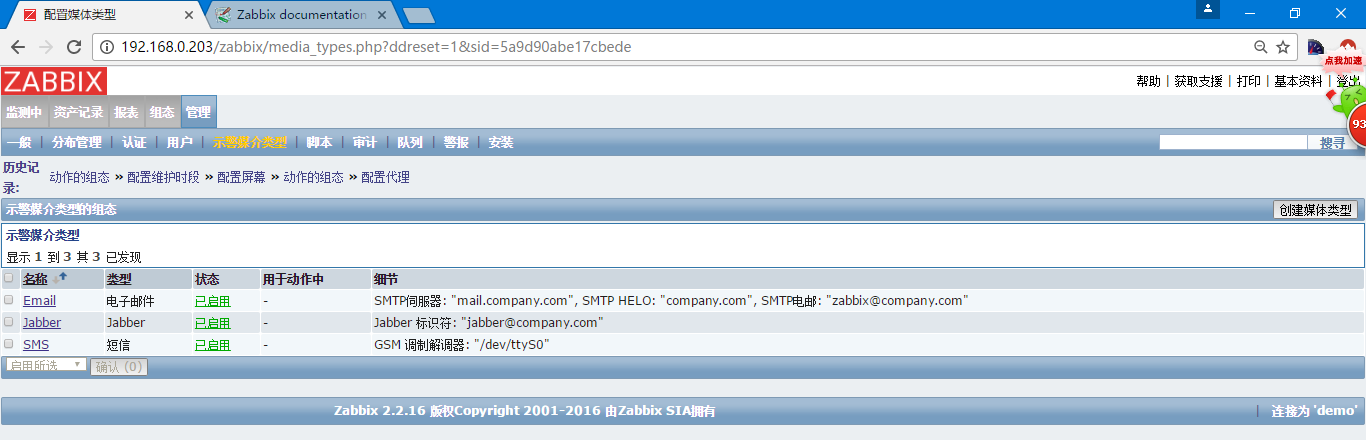
通过配置文件,可以看到报警的脚本存放路径
[root@heartbeat1 ~]# vi /etc/zabbix_server.conf
AlertScriptsPath=/var/lib/zabbixsrv/alertscripts
脚本需要三个参数
- 第一个参数为介质,例如短息就为手机号,邮件就为邮件地址
- 第二个参数为标题
- 第三个参数为内容
[root@heartbeat1 ~]# cd /var/lib/zabbixsrv/alertscripts
[root@heartbeat1 alertscripts]# vi send_mail.sh
#!/bin/bash
MAIL_TITLE=$2
MAIL_CON=$3
echo "$MAIL_CON" | /bin/mail -s "$MAIL_TITLE" $1
创建媒体类型
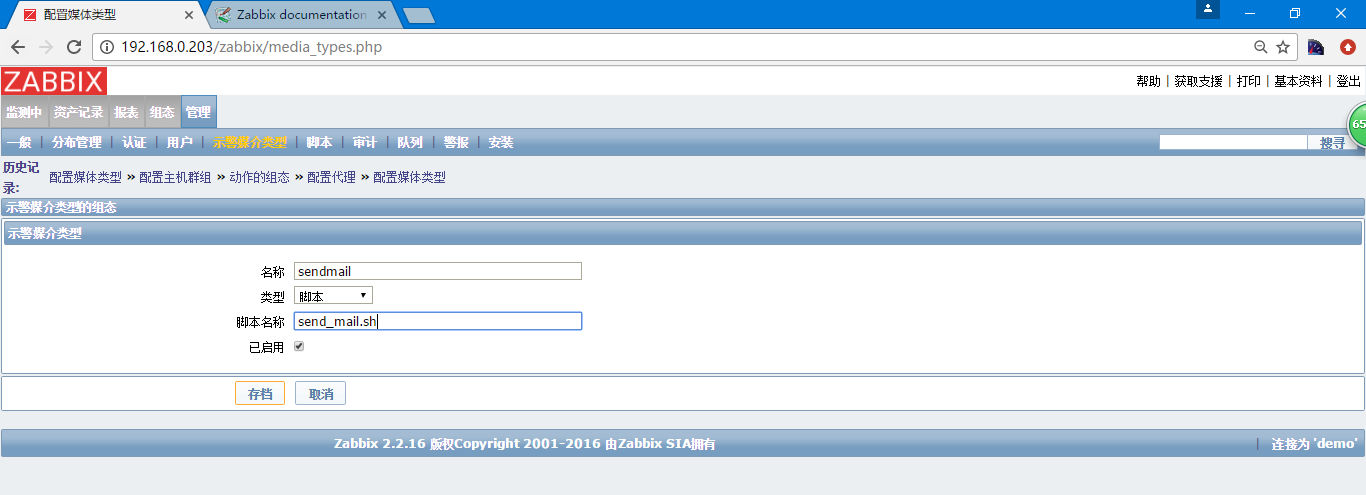
类型为脚本,然后脚本名称为刚才创建的脚本,会根据配置文件中脚本的路径进行查找 更新报警行为中的报警类型
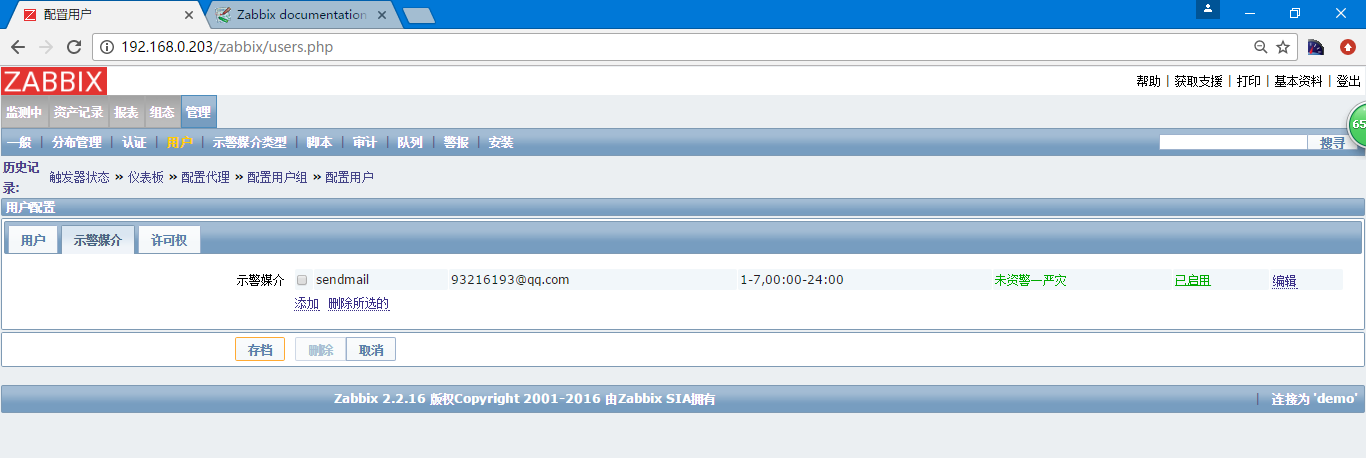
配置用户的报警媒介
保存一下
我们可以模拟故障,关闭监控的MySQL服务
[root@heartbeat2 ~]# service mysqld stop
Shutting down MySQL.                                       [确定]
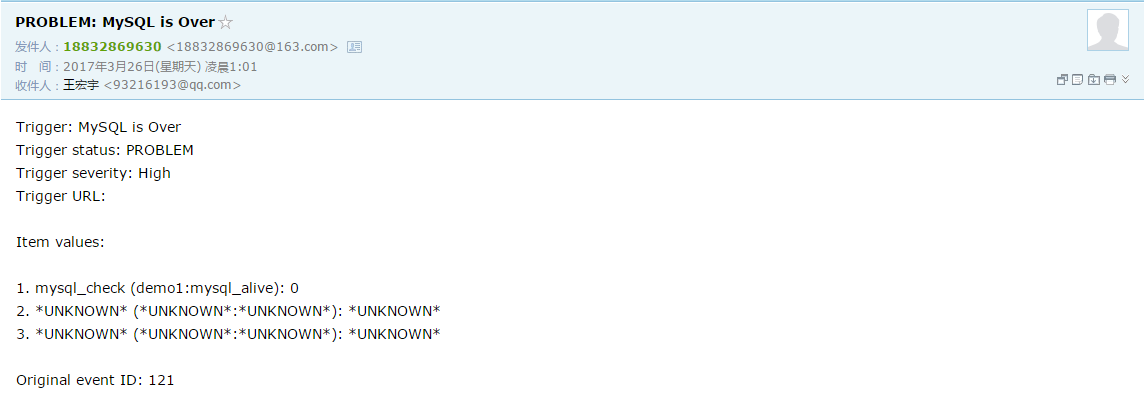
可以看到zabbix的监控到了MySQL宕机,并且进行了发送邮件,我这边也收到了邮件
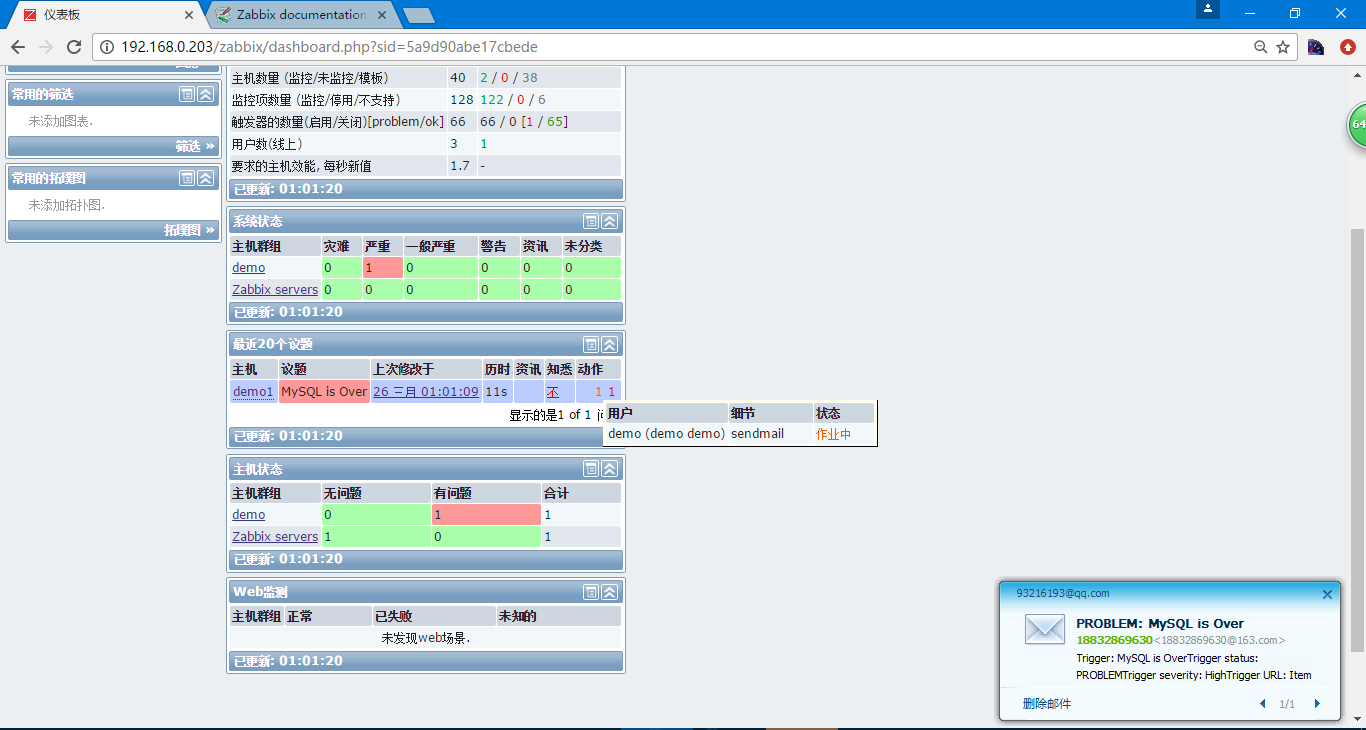
邮件内容和格式一致
linux发送邮件参考http://www.whysdomain.com/blog/90/中的Linux通过SMTP使用163邮箱发送邮件
批量添加
添加web监控
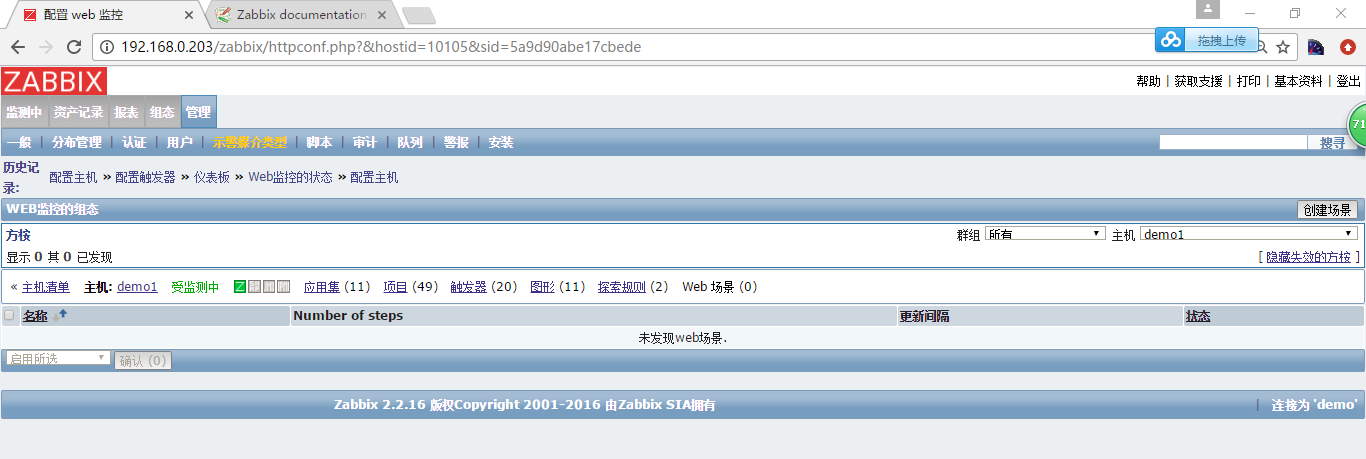
选择创建场景
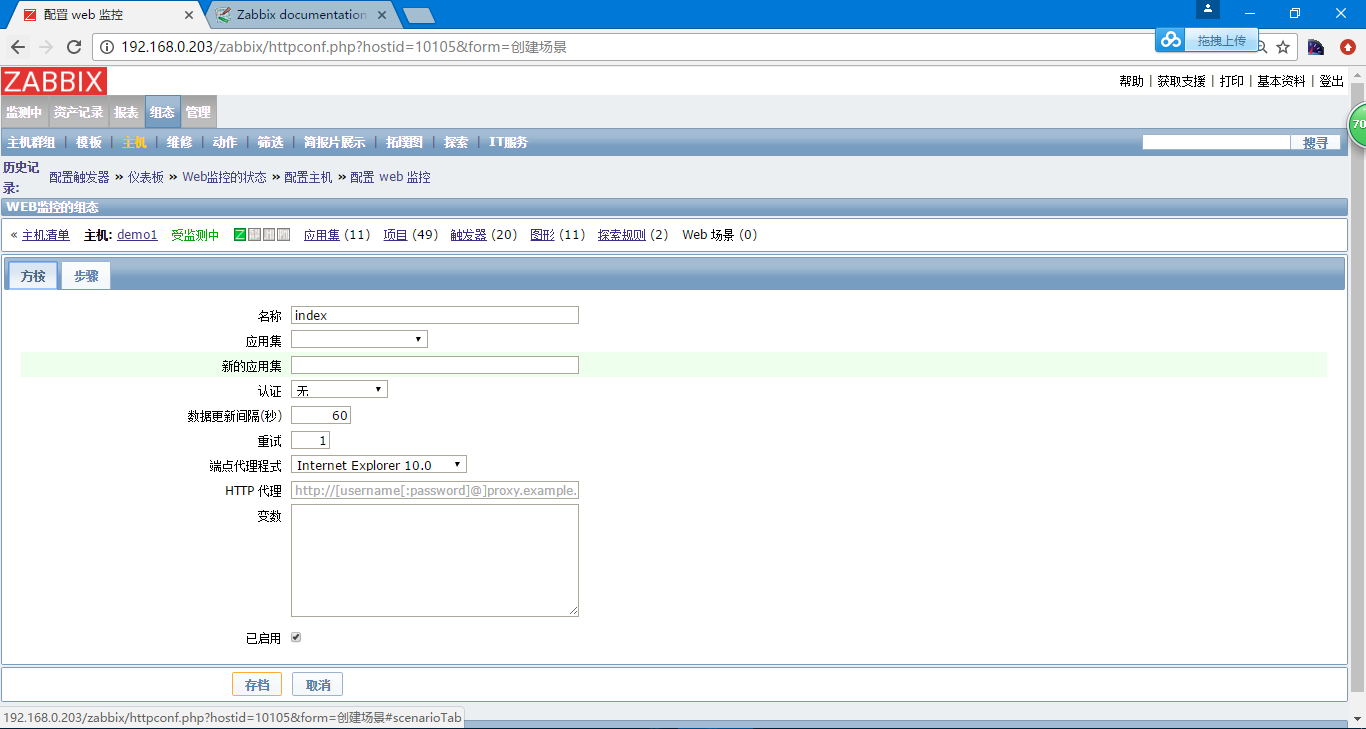
选择检测步骤
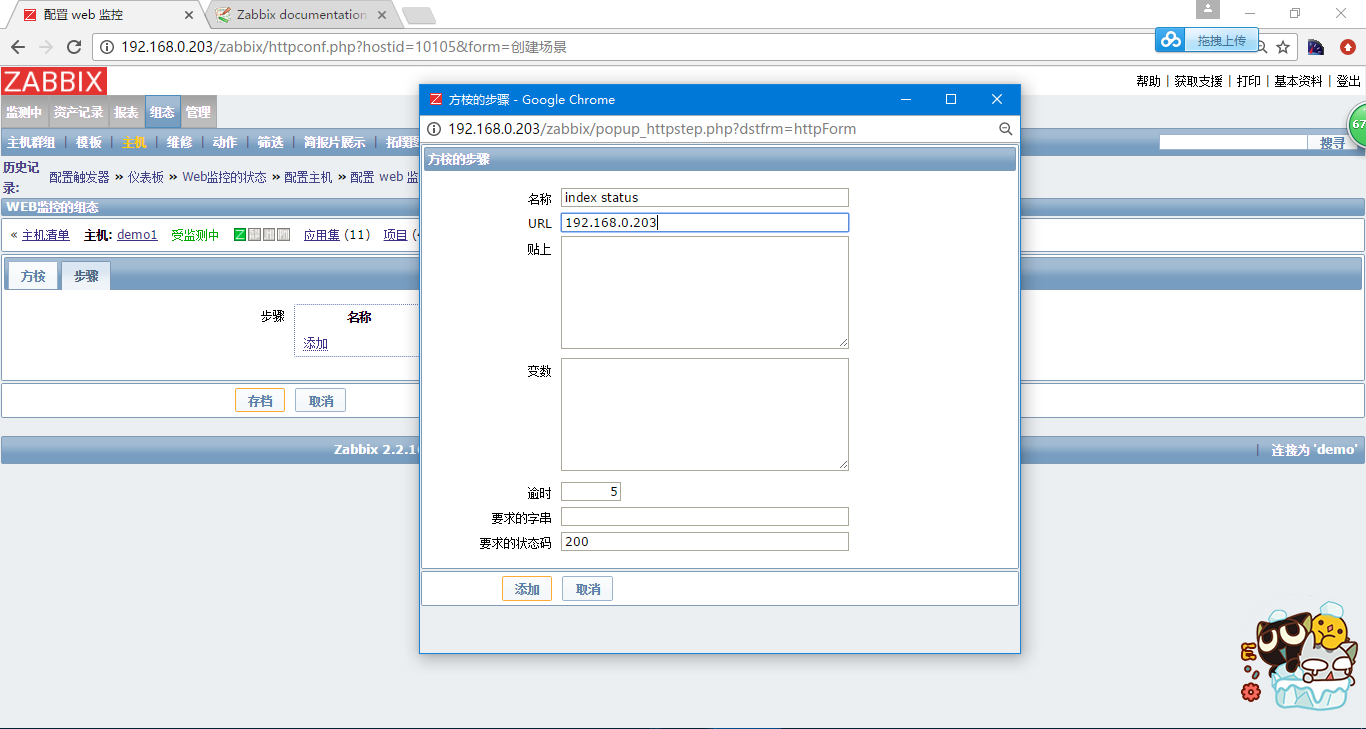
[root@heartbeat2 ~]# curl --head 192.168.0.203
HTTP/1.1 200 OK
Date: Sat, 25 Mar 2017 19:05:41 GMT
Server: Apache/2.2.15 (CentOS)
Last-Modified: Tue, 07 Mar 2017 20:18:54 GMT
ETag: "c0dd0-e-54a29b89b75f5"
Accept-Ranges: bytes
Content-Length: 14
Connection: close
Content-Type: text/html; charset=UTF-8
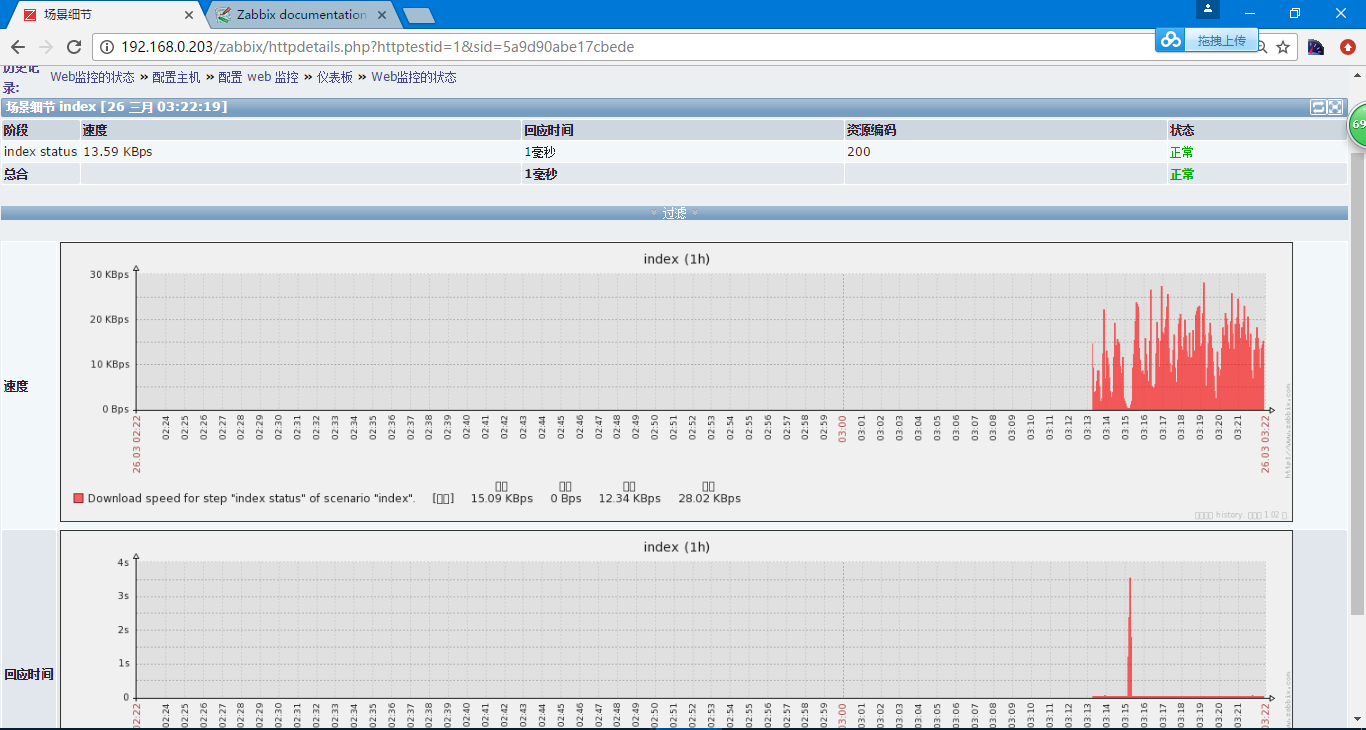
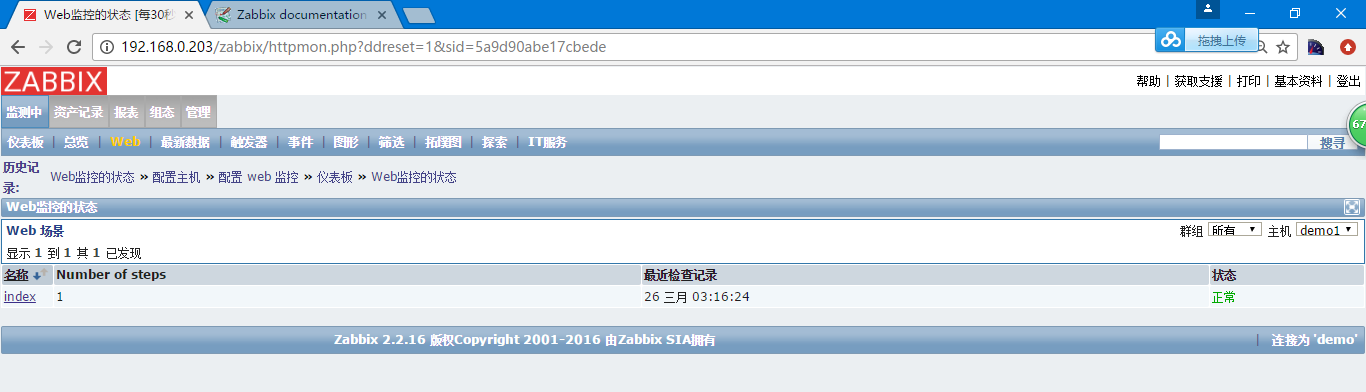
进行保存,可以在Dashboard中的web栏里看到
点进去有更详细的信息和历史信息图