

<服务架构>ELK
目录:
ELK是为了解决各个系统日志数据分散难以查找,并且日志数据量过大,查询速度慢或者数据不够实时的问题,包含Elasticsearch+LogStash+Kibana,此次使用版本为Elasticsearc1.7.0,logstash 1.5.3,kibana 4.1.1,对于ELK来讲,Elasticsearch被作为的是一个日志存储的数据库,主要的是logstash如何收集到数据,并且以什么格式来收集数据的问题,kibana作为查询和数据展现的工具,可以不懂Elasticsearch也可以进行数据分析,当然可以自行开发代替kibana的。
Elasticsearch
安装Elasticsearc
首先要安装jdk,并配置环境变量
[root@heartbeat1 ~]# wget https://download.elastic.co/elasticsearch/elasticsearch/elasticsearch-1.7.0.tar.gz
[root@heartbeat1 ~]# tar xf elasticsearch-1.7.0.tar.gz
[root@heartbeat1 ~]# mv elasticsearch-1.7.0 /usr/local/elasticsearch
[root@heartbeat1 ~]# cd  !$
cd  /usr/local/elasticsearch
[root@heartbeat1 elasticsearch]# ll
total 40
-rw-rw-r-- 1 root root 11358 Mar 23  2015 LICENSE.txt
-rw-rw-r-- 1 root root   150 Jun  9  2015 NOTICE.txt
-rw-rw-r-- 1 root root  8700 Jun  9  2015 README.textile
drwxr-xr-x 2 root root  4096 Mar 18 22:05 bin
drwxr-xr-x 2 root root  4096 Mar 18 22:05 config
drwxr-xr-x 3 root root  4096 Mar 18 22:05 lib
配置文件解释
[root@heartbeat1 elasticsearch]# cd config/
[root@heartbeat1 config]# vim elasticsearch.yml
#cluster.name: elasticsearch            #注意同一局域网内是不能存在相同名字的,因为es是通过组播发现同一集群主机,依据就是集群名称
#node.name: "Franz Kafka"               #节点名字
#node.master: true                      #节点是否可以被选举为master节点
#node.data: true                        #节点是否存储数据
#index.number_of_shards: 5              #索引分片
#index.number_of_replicas: 1            #分片部分,如果大于1,就会有的节点为主分片角色,分片副本角色,分片副本可以直接从主分片复制,如果主分片挂了就提升分片副本为主分片进行复制一个分片副本
#path.conf: /path/to/conf               #配置路径
#path.data: /path/to/data               #数据路径
#path.data: /path/to/data1,/path/to/data2   #数据路径可以配置多个
#path.work: /path/to/work               #临时文件路径
#path.logs: /path/to/logs               #日志路径
#path.plugins: /path/to/plugins         #插件路径
#bootstrap.mlockall: true               #锁住内存,用于jvm有足够的内存,保证效率
#network.bind_host: 192.168.0.1         #绑定IP
#network.publish_host: 192.168.0.1      #节点间交互使用IP
#network.host: 192.168.0.1              #绑定IP和节点间交互IP使用同一IP
#transport.tcp.port: 9300               #通信端口
#transport.tcp.compress: true           #TCP压缩
#http.port: 9200                        #对外提供服务的端口
使用配置
[root@heartbeat1 config]# grep '^[a-z]' elasticsearch.yml
cluster.name: whyselasticsearch
node.name: "heartbeat1"
node.master: true
index.number_of_shards: 5
index.number_of_replicas: 1
path.conf: /usr/local/elasticsearch/config
path.data: /usr/local/elasticsearch/data
path.work: /usr/local/elasticsearch/work
path.logs: /usr/local/elasticsearch/logs
path.plugins: /usr/local/elasticsearch/plugins
bootstrap.mlockall: true
network.host: 192.168.0.203
transport.tcp.port: 9300
transport.tcp.compress: true
http.port: 9200
启动Elasticsearc
[root@heartbeat1 ~]# /usr/local/elasticsearch/bin/elasticsearch -d
[root@heartbeat1 ~]# ss -nlput | egrep '9200|9300'
tcp    LISTEN     0      50                    :::9300                 :::*      users:(("java",2152,57))
[root@heartbeat1 ~]# ss -nlput | egrep '9200|9300'
tcp    LISTEN     0      50                    :::9200                 :::*      users:(("java",2152,95))
tcp    LISTEN     0      50                    :::9300                 :::*      users:(("java",2152,57))
[root@heartbeat1 ~]# curl 192.168.0.203:9200                        #检测
{
  "status" : 200,
  "name" : "heartbeat1",
  "cluster_name" : "whyselasticsearch",
  "version" : {
    "number" : "1.7.0",
    "build_hash" : "929b9739cae115e73c346cb5f9a6f24ba735a743",
    "build_timestamp" : "2015-07-16T14:31:07Z",
    "build_snapshot" : false,
    "lucene_version" : "4.10.4"
  },
  "tagline" : "You Know, for Search"
}
[root@heartbeat1 ~]# jps
2257 Jps
2152 Elasticsearch
[root@heartbeat1 ~]# kill 2152
[root@heartbeat1 ~]# jps
2271 Jps
下载git上的添加自启动脚本的工具
[root@heartbeat1 elasticsearch]# git clone https://github.com/elastic/elasticsearch-servicewrapper.git
Initialized empty Git repository in /usr/local/elasticsearch/elasticsearch-servicewrapper/.git/
remote: Counting objects: 184, done.
remote: Total 184 (delta 0), reused 0 (delta 0), pack-reused 184
Receiving objects: 100% (184/184), 4.32 MiB | 6 KiB/s, done.
Resolving deltas: 100% (70/70), done.
[root@heartbeat1 elasticsearch]# mv elasticsearch-servicewrapper/service/ /usr/local/elasticsearch/bin
[root@heartbeat1 elasticsearch]# /usr/local/elasticsearch/bin/service/elasticsearch
Usage: /usr/local/elasticsearch/bin/service/elasticsearch [ console | start | stop | restart | condrestart | status | install | remove | dump ]

Commands:
  console      Launch in the current console.
  start        Start in the background as a daemon process.
  stop         Stop if running as a daemon or in another console.
  restart      Stop if running and then start.
  condrestart  Restart only if already running.
  status       Query the current status.
  install      Install to start automatically when system boots.
  remove       Uninstall.
  dump         Request a Java thread dump if running.

[root@heartbeat1 elasticsearch]# /usr/local/elasticsearch/bin/service/elasticsearch install             #安装启动脚本
Detected RHEL or Fedora:
Installing the Elasticsearch daemon..
[root@heartbeat1 elasticsearch]# ls /etc/init.d/elasticsearch
/etc/init.d/elasticsearch

[root@heartbeat1 elasticsearch-servicewrapper]# cd ..
[root@heartbeat1 elasticsearch]# cd bin/service
[root@heartbeat1 service]# vi elasticsearch.conf
set.default.ES_HOME=<Path to Elasticsearch Home>
set.default.ES_HEAP_SIZE=1024
可以看到默认的堆内存为1024,所以说需要主机内存要大于该值才能正常启动
启动Elasticsearch
[root@heartbeat1 service]# /etc/init.d/elasticsearch start
Starting Elasticsearch...
Waiting for Elasticsearch......
running: PID:2542
使用Elasticsearch
Elasticsearch提供了两种方式,JAVA API 和 RESTful API等进行操作
curl -X<VERB> '<PROTOCOL>://<HOST>/<PATH>?<QUERY_STRING>' -d '<BODY>'
- VERB HTTP的方法,包括GET,POST,PUT,HEAD,DELETE等
- PROTOCOL http或https协议
- QUERY_STRING 可选的查询请求参数,例如?pretty参数使请求返回易读的JSON数据
- BODY 一个JSON格式的请求主体
创建索引
[root@heartbeat1 service]# curl -XGET 'http://192.168.0.203:9200/_count?pretty' -d '
> {
>   "query":{
>     "match_all":{}
>   }
> }'
{
  "count" : 0,
  "_shards" : {
    "total" : 0,
    "successful" : 0,
    "failed" : 0
  }
}
[root@heartbeat1 service]# curl -i  -XGET 'http://192.168.0.203:9200/_count?pretty' -d '
{
  "query":{
    "match_all":{}
  }
}'
HTTP/1.1 200 OK
Content-Type: application/json; charset=UTF-8
Content-Length: 95

{
  "count" : 0,
  "_shards" : {
    "total" : 0,
    "successful" : 0,
    "failed" : 0
  }
}
如果加上-i会显示一些头部的信息
Elasticsearch插件
[root@heartbeat1 service]# /usr/local/elasticsearch/bin/plugin -i elasticsearch/marvel/latest
-> Installing elasticsearch/marvel/latest...
Trying http://download.elasticsearch.org/elasticsearch/marvel/marvel-latest.zip...
Downloading ......................................................................DONE
failed to extract plugin [/usr/local/elasticsearch/plugins/marvel.zip]: ZipException[error in opening zip file]

[root@heartbeat1 service]# cd ../../plugins/
[root@heartbeat1 plugins]# mkdir marvel
[root@heartbeat1 plugins]# cd marvel
[root@heartbeat1 marvel]# wget http://download.elasticsearch.org/elasticsearch/marvel/marvel-1.3.1.zip
[root@heartbeat1 marvel]# unzip marvel-1.3.1.zip
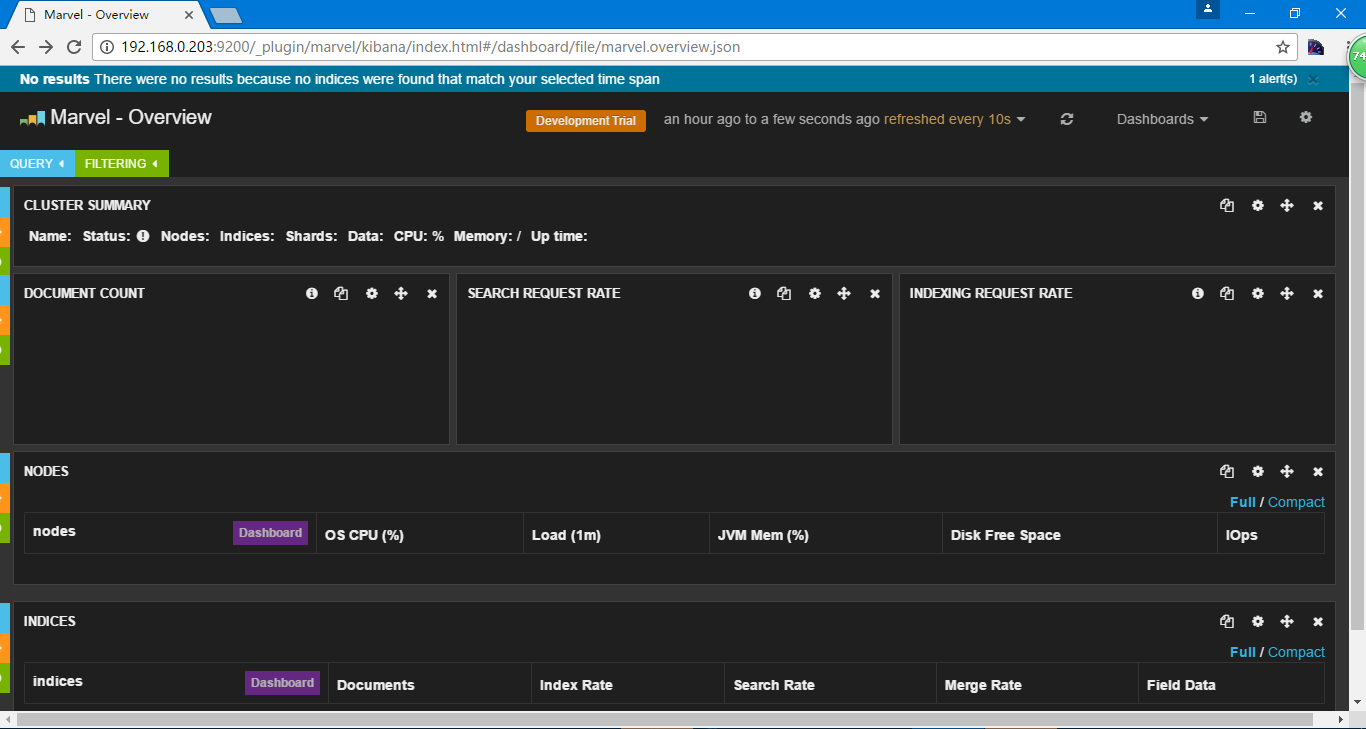
访问http://192.168.0.203:9200/_plugin/marvel/
 选择Continue Free Trial试用
添加索引
[root@heartbeat1 ~]# curl -i  -XPOST 'http://192.168.0.203:9200/index-demo/test?pretty' -d '
> {
>   "user":"why",
>   "mesg":"whysdomain"
> }
> '
HTTP/1.1 201 Created
Content-Type: application/json; charset=UTF-8
Content-Length: 122

{
  "_index" : "index-demo",
  "_type" : "test",
  "_id" : "AVrideReJDXfoY2FnlSy",
  "_version" : 1,
  "created" : true
}
创建一个索引,名称为index-demo,test,用户为why,内容为whysdomain
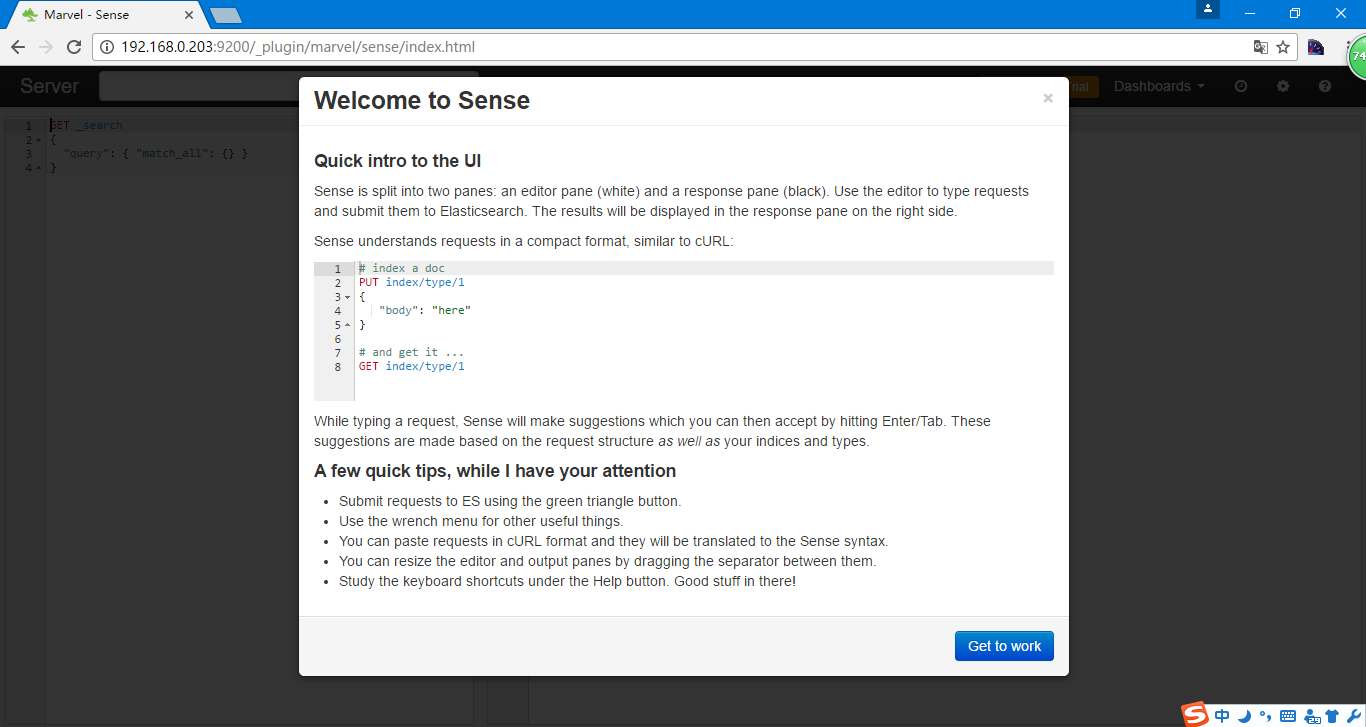
在Dashboards中选择Sense
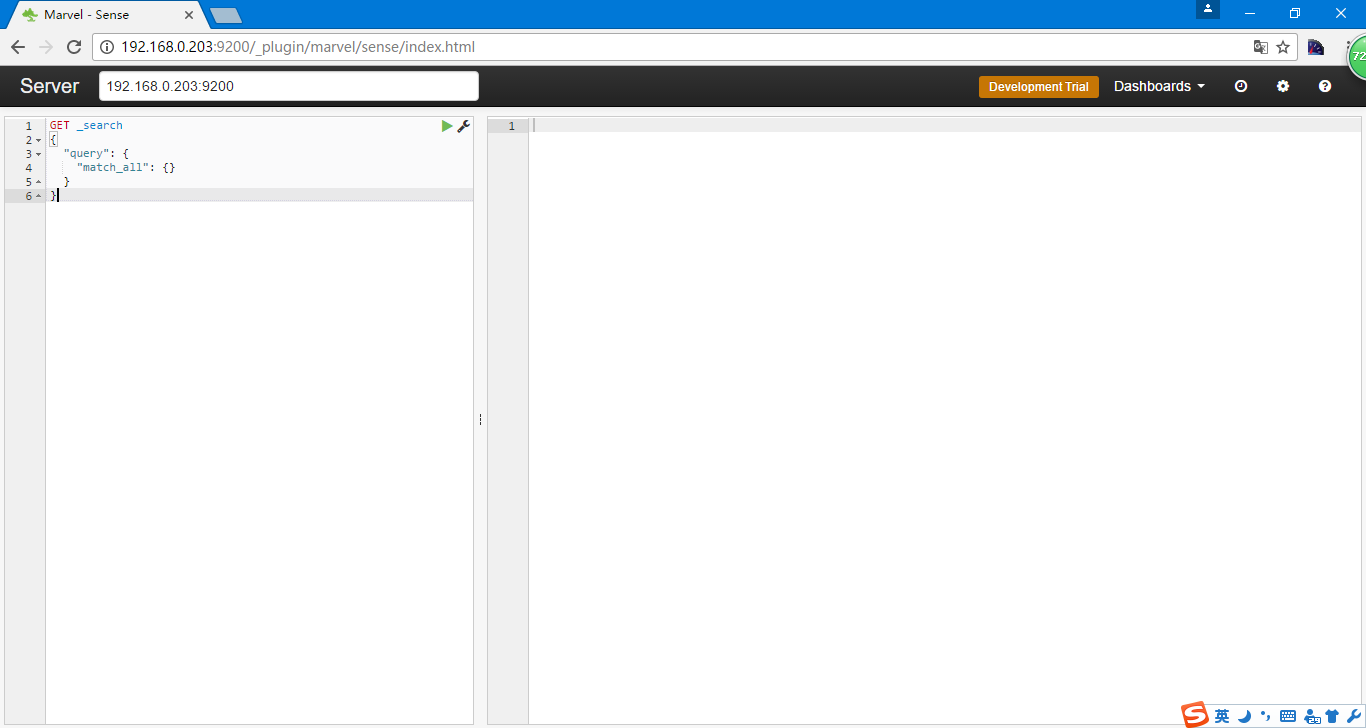
输入
GET /index-demo/test/AVrideReJDXfoY2FnlSy
点开始箭头
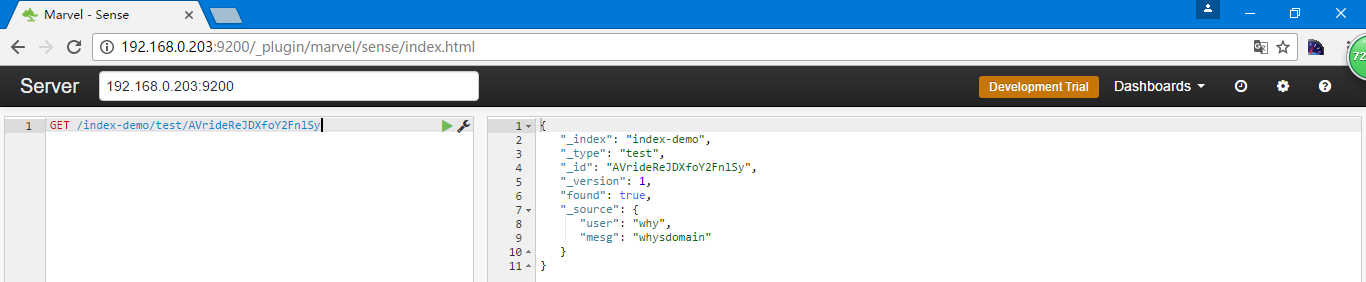
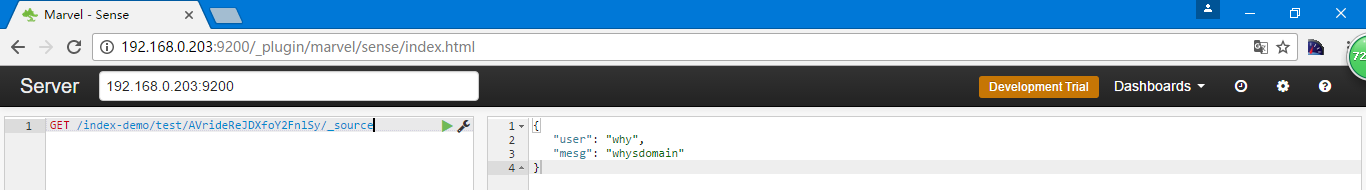
如果只想看到内容可以加上_source
GET /index-demo/test/AVrideReJDXfoY2FnlSy/_source
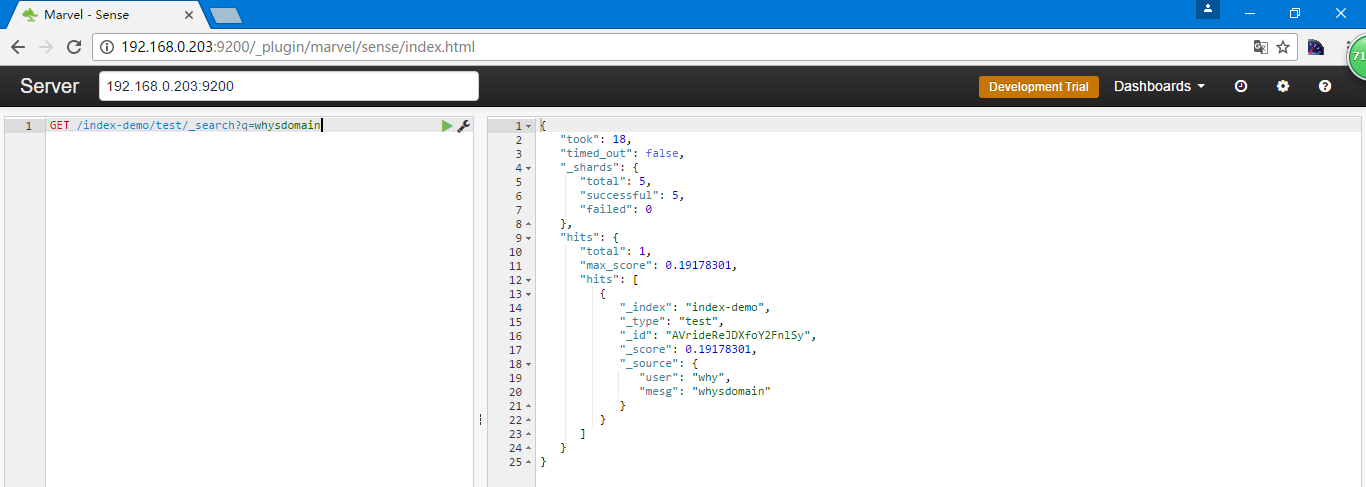
如果想进行搜索
GET /index-demo/test/_search?q=whysdomain
安装集群管理插件head
[root@heartbeat1 ~]# /usr/local/elasticsearch/bin/plugin -i mobz/elasticsearch-head
-> Installing mobz/elasticsearch-head...
Trying https://github.com/mobz/elasticsearch-head/archive/master.zip...
Downloading ...................................................................................................................................................................................................................................................................................................................................................................................................................................................................................................................................................................................................................................................................................................DONE
Installed mobz/elasticsearch-head into /usr/local/elasticsearch/plugins/head
当然数据量特别大的时候不推荐使用head
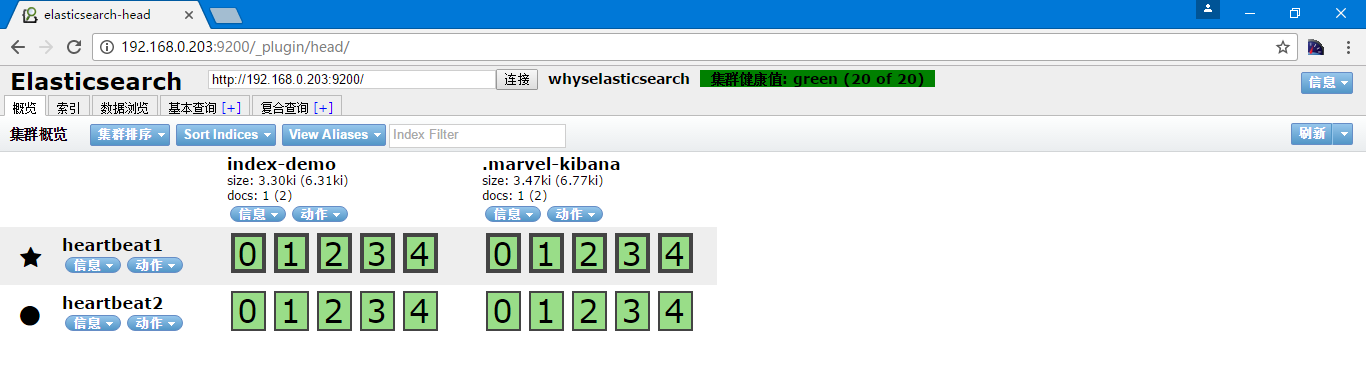
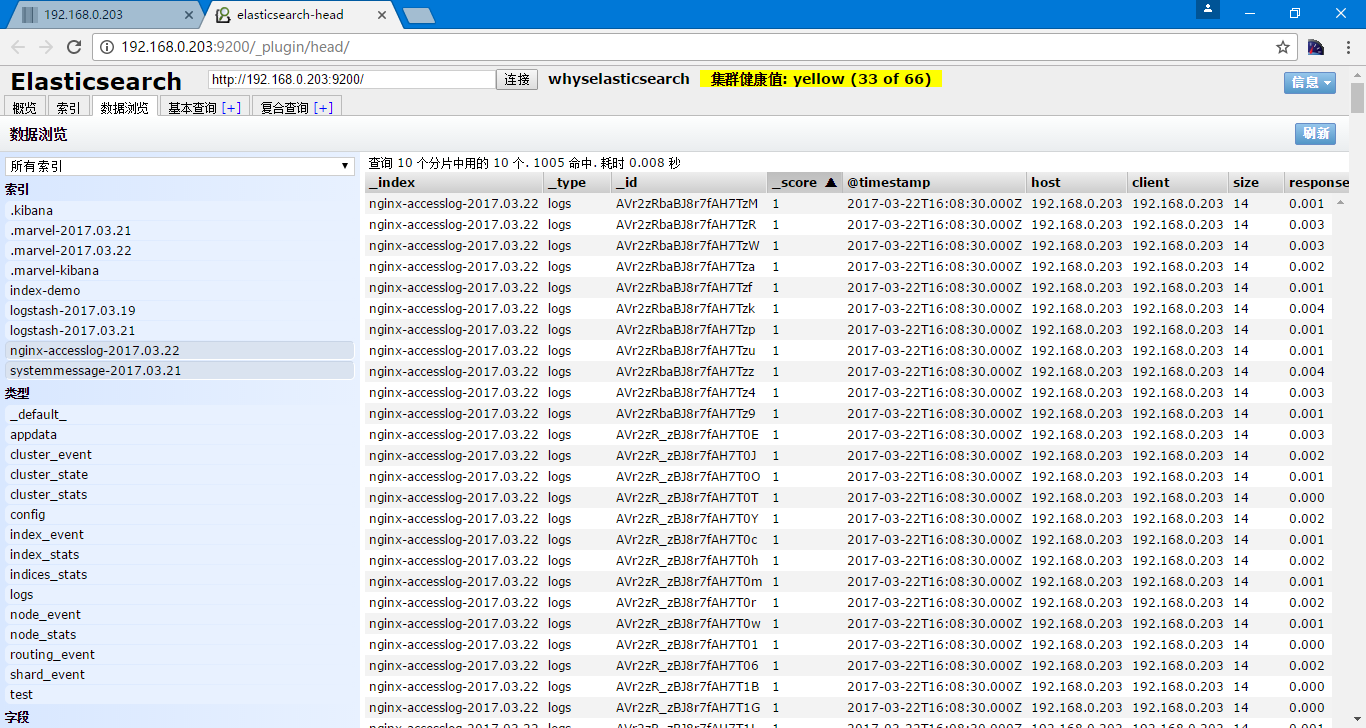
通过访问http://192.168.0.203:9200/_plugin/head/实现
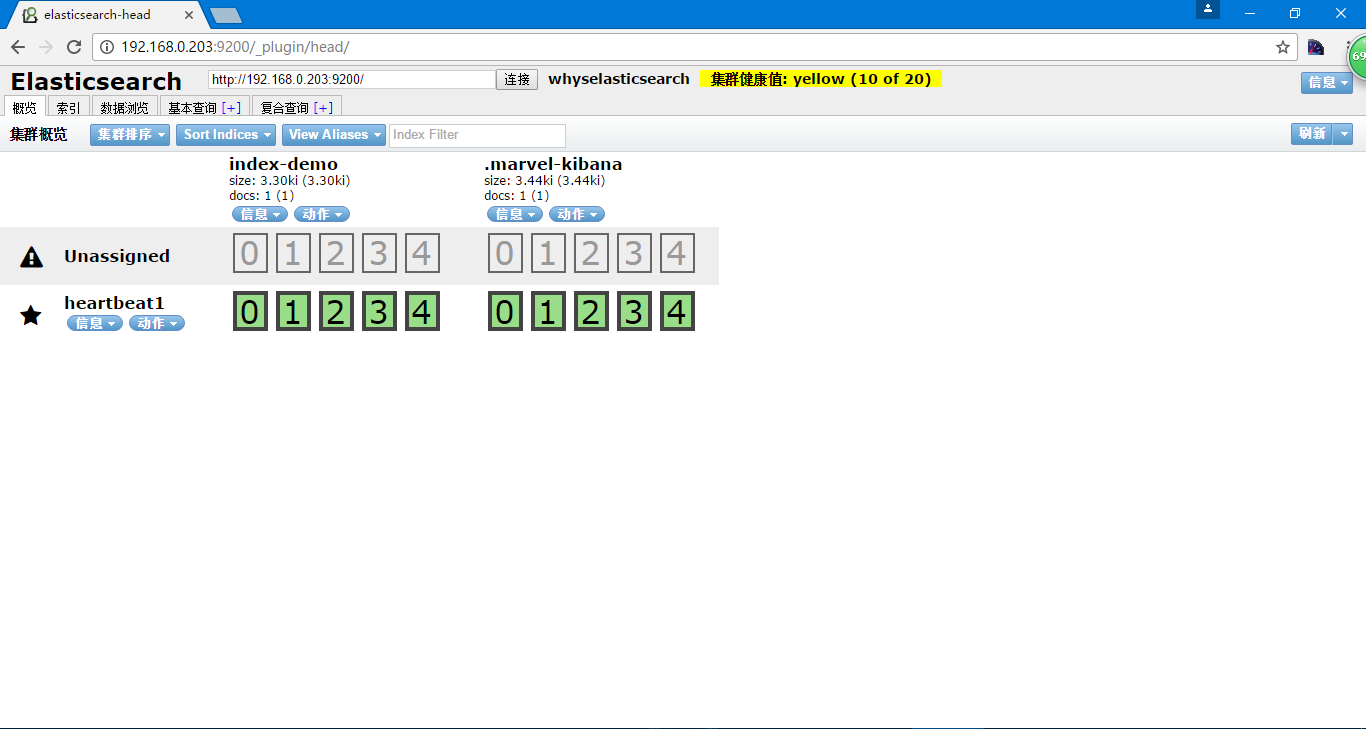
有我们当时创建的索引index-demo和.marvel-kibana
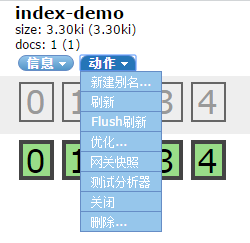
点一下动作可以看到更多的信息
再添加一台机器
[root@heartbeat2 ~]# grep '^[a-z]' !$
grep '^[a-z]' /usr/local/elasticsearch/config/elasticsearch.yml
cluster.name: whyselasticsearch
node.name: "heartbeat2"
node.master: true
index.number_of_shards: 5
index.number_of_replicas: 1
path.conf: /usr/local/elasticsearch/config
path.data: /usr/local/elasticsearch/data
path.work: /usr/local/elasticsearch/work
path.logs: /usr/local/elasticsearch/logs
path.plugins: /usr/local/elasticsearch/plugins
bootstrap.mlockall: true
transport.tcp.port: 9300
transport.tcp.compress: true
http.port: 9200
[root@heartbeat2 ~]# /usr/local/elasticsearch/bin/elasticsearch
[2017-03-19 23:49:12,688][INFO ][node                     ] [heartbeat2] version[1.7.0], pid[2774], build[929b973/2015-07-16T14:31:07Z]
[2017-03-19 23:49:12,692][INFO ][node                     ] [heartbeat2] initializing ...
[2017-03-19 23:49:12,987][INFO ][plugins                  ] [heartbeat2] loaded [], sites []
[2017-03-19 23:49:13,057][INFO ][env                      ] [heartbeat2] using [1] data paths, mounts [[/ (/dev/sda2)]], net usable_space [10.8gb], net total_space [19.2gb], types [ext4]
[2017-03-19 23:49:19,808][INFO ][node                     ] [heartbeat2] initialized
[2017-03-19 23:49:19,808][INFO ][node                     ] [heartbeat2] starting ...
[2017-03-19 23:49:20,109][INFO ][transport                ] [heartbeat2] bound_address {inet[/0:0:0:0:0:0:0:0:9300]}, publish_address {inet[/192.168.0.211:9300]}
[2017-03-19 23:49:20,444][INFO ][discovery                ] [heartbeat2] whyselasticsearch/1IF1ZarrS1ivX1gsrOwwkQ
[2017-03-19 23:49:23,621][INFO ][cluster.service          ] [heartbeat2] detected_master [heartbeat1][QES5Pxl_S_KuGgNjDsF-kg][heartbeat1][inet[/192.168.0.203:9300]]{master=true}, added {[heartbeat1][QES5Pxl_S_KuGgNjDsF-kg][heartbeat1][inet[/192.168.0.203:9300]]{master=true},}, reason: zen-disco-receive(from master [[heartbeat1][QES5Pxl_S_KuGgNjDsF-kg][heartbeat1][inet[/192.168.0.203:9300]]{master=true}])
[2017-03-19 23:49:23,699][INFO ][http                     ] [heartbeat2] bound_address {inet[/0:0:0:0:0:0:0:0:9200]}, publish_address {inet[/192.168.0.211:9200]}
[2017-03-19 23:49:23,701][INFO ][node                     ] [heartbeat2] started
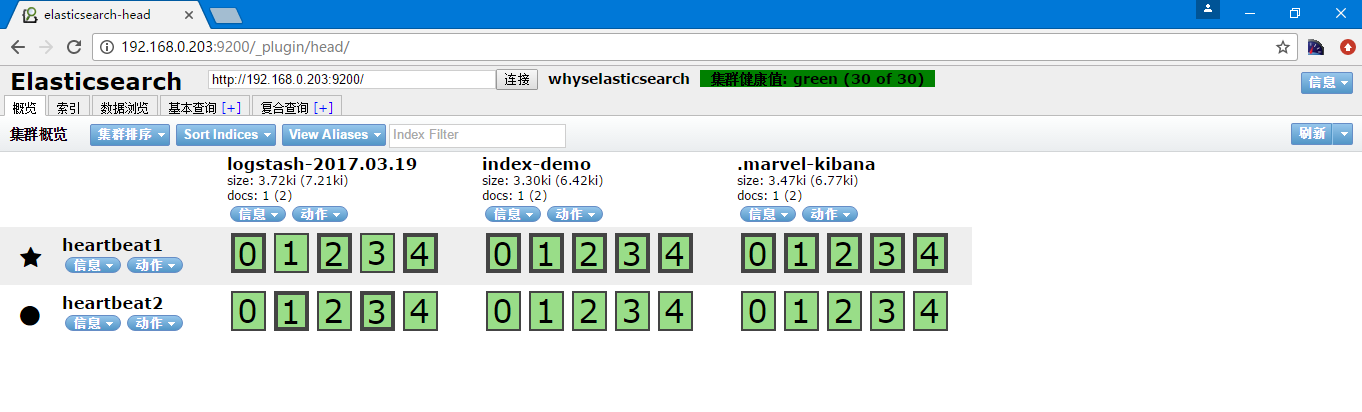
再次访问http://192.168.0.203:9200/_plugin/head可以看到节点已经被加入进来了
这个过程是组播的形式进行的,也可以是单播,通过以下参数配置
#discovery.zen.ping.multicast.enabled: false                    #关闭组播
#discovery.zen.ping.unicast.hosts: ["host1", "host2:port"]      #单播列表
这样也就能解决不在一个网段的ES问题。
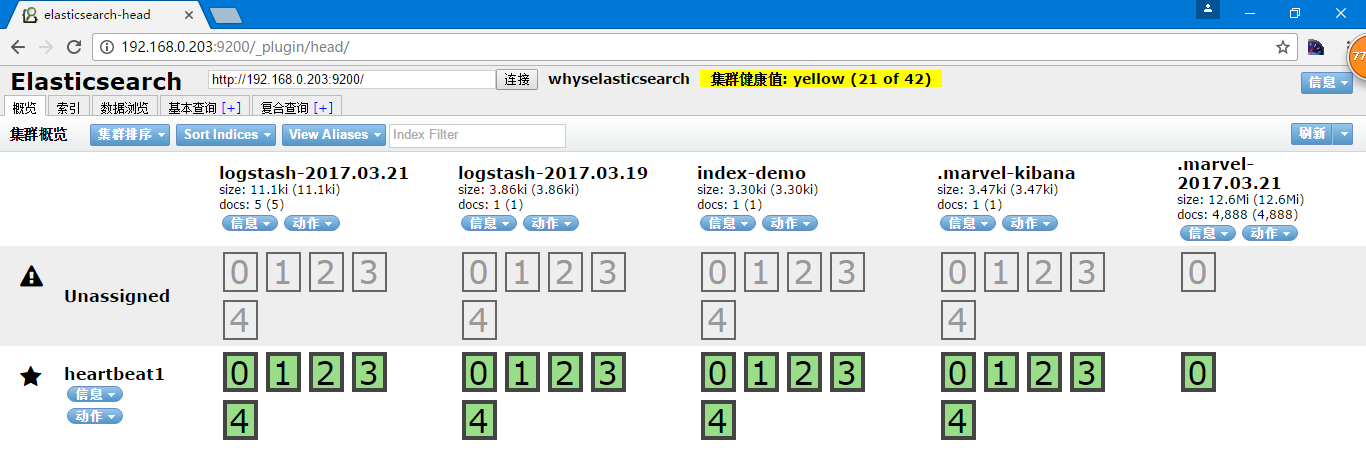
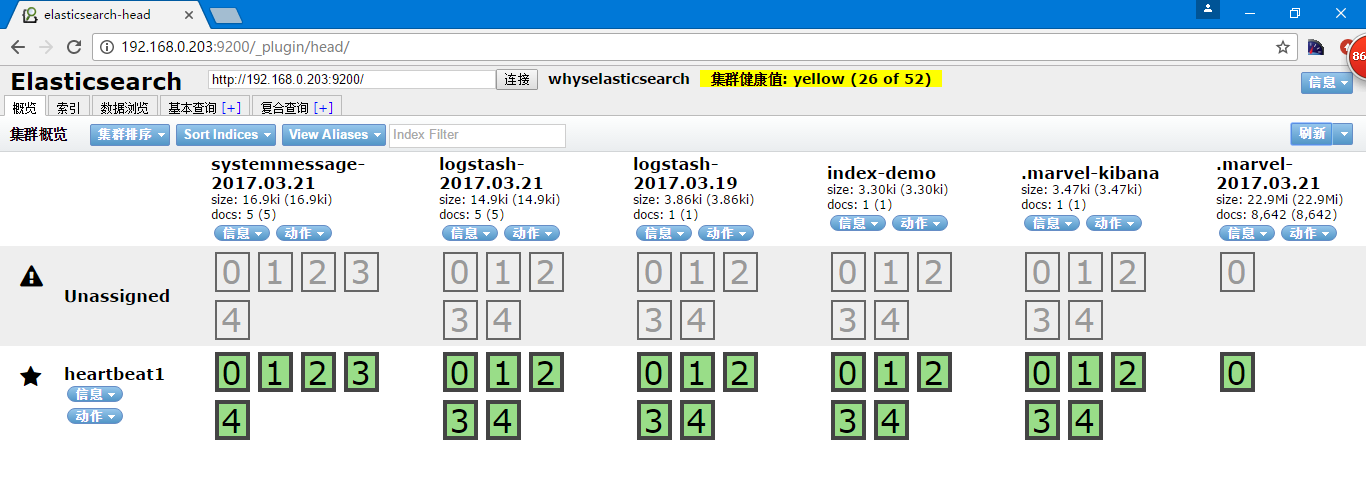
启动都在很短的时间内就发现了新增的节点,可以看到主分片为带黑色边框的,五角星为主节点,圆形为工作节点,集群健康状态,绿色代表非常正常,而黄色代表主分片数据正常,而副本分片缺失,红色则代表主分片丢失
通过curl获取集群状态
[root@heartbeat1 ~]# curl -XGET 192.168.0.203:9200/_cluster/health?pretty
{
  "cluster_name" : "whyselasticsearch",
  "status" : "green",
  "timed_out" : false,
  "number_of_nodes" : 2,                #节点
  "number_of_data_nodes" : 2,           #数据节点
  "active_primary_shards" : 10,         #主分片数量,配置中每个索引默认为5个分片,2个索引
  "active_shards" : 20,                 #所有活动分片,每一个
  "relocating_shards" : 0,              #正在迁移的分片迁移
  "initializing_shards" : 0,            #正在初始化的分片
  "unassigned_shards" : 0,              #没有分配节点的分片
  "delayed_unassigned_shards" : 0,
  "number_of_pending_tasks" : 0,
  "number_of_in_flight_fetch" : 0
}
一个比较常用的参数
#indices.recovery.max_bytes_per_sec: 20mb #分片恢复带宽
官方文档
https://www.elastic.co/guide/en/elasticsearch/guide/current/index.html,这里包含很多文档,而我们经常关注的是这个文档https://www.elastic.co/guide/en/elasticsearch/guide/current/administration.html

这里有很多,可以自行去看
ES5.2配置链接,Mapping中的Mapping parameters
Production Deployment
- 内存推荐为64G,当然32G和16G也ok,jvm为内存的一半,但是不要超过32G,并关闭swap
- cpu磁盘如果是ssd可以使用cpu的调度策略为noop或者deadline
- 磁盘可以做raid0
- 网络的话为千兆网络
- 文件描述符和sysctl -w vm.max_map_count=2621443
Post-Deployment
- 修改运行集群的配置
- 日志
- 索引性能
- 滚动升级
- 快照,创建备份路径,每个节点的路径必须一样,一般业务的索引做快照,日志就不需要做了
滚动升级
- 如果可以,就不写入新的数据,恢复的时候比较快,当然可以不做
- 关闭自动分片
- 关闭节点
- 然后就可以维护或者升级了
- 然后重启节点
- 打开自动分片
- 然后每个节点都执行一次
elasticsearch的工作原理
启动的时候进行组播进行发现,然后在返回后会加入到集群内,然后选举出主节点,但是主节点在elasticsearch集群没有什么特别之处,连接任何一台节点都可以完成操作,elasticsearch内部进行分发,在必要的情况下会放到其他节点进行执行,然后进行汇总返回,主节点的主要目的是读取集群状态,在必要的时候进行恢复分片工作,检测的过程就是用过ping的方式获取状态,确定节点是否失效
更多的原理也可以看一下elastsearch权威指南
logstash
安装logstash
[root@heartbeat1 ~]# wget https://download.elastic.co/logstash/logstash/logstash-1.5.3.tar.gz
[root@heartbeat1 ~]# tar xf logstash-1.5.3.tar.gz
[root@heartbeat1 ~]# mv logstash-1.5.3  /usr/local/logstash
简单的使用logstash
[root@heartbeat1 ~]# /usr/local/logstash/bin/logstash -e 'input { stdin{} } output { stdout{} }'
Logstash startup completed
I have a dream          #输入
2017-03-19T17:25:10.643Z heartbeat1 I hive a dreamI have a dream        #返回
^CSIGINT received. Shutting down the pipeline. {:level=>:warn}          #关掉服务crtl+c
^CSIGINT received. Terminating immediately.. {:level=>:fatal}
[root@heartbeat1 ~]#
使用logstash通过rubydebug模式输出
[root@heartbeat1 ~]# /usr/local/logstash/bin/logstash -e 'input { stdin{} } output { stdout{codec => rubydebug} }'
Logstash startup completed
I have a dream
{
       "message" => "I have a dream",
      "@version" => "1",
    "@timestamp" => "2017-03-19T17:27:47.322Z",
          "host" => "heartbeat1"
}
^CSIGINT received. Shutting down the pipeline. {:level=>:warn}
^CSIGINT received. Terminating immediately.. {:level=>:fatal}
使用logstash输出到Elasticsearch
[root@heartbeat1 ~]# /usr/local/logstash/bin/logstash -e 'input { stdin{} } output { elasticsearch { host => "192.168.0.203" protocol => "http" } }'
'[DEPRECATED] use `require 'concurrent'` instead of `require 'concurrent_ruby'`
Logstash startup completed
I have a dream
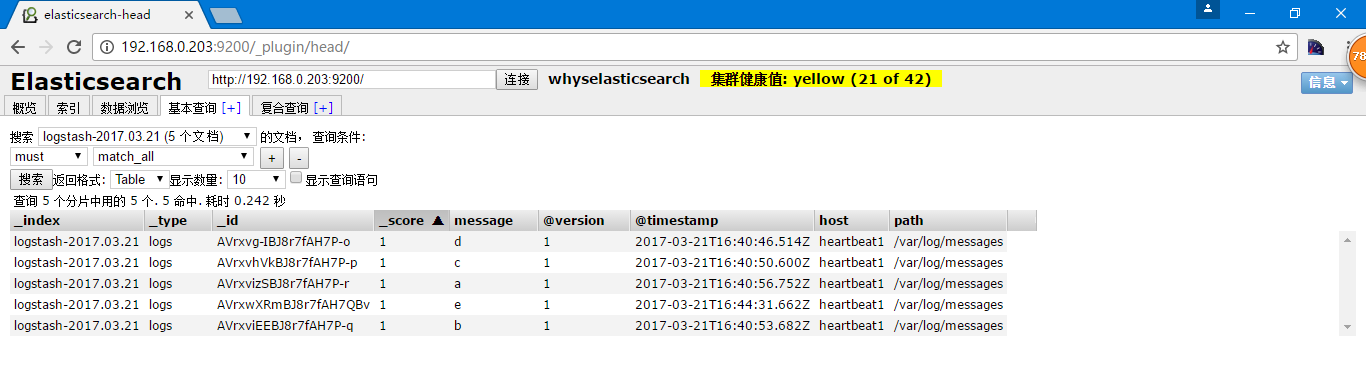
可以到elasticsearch中查看
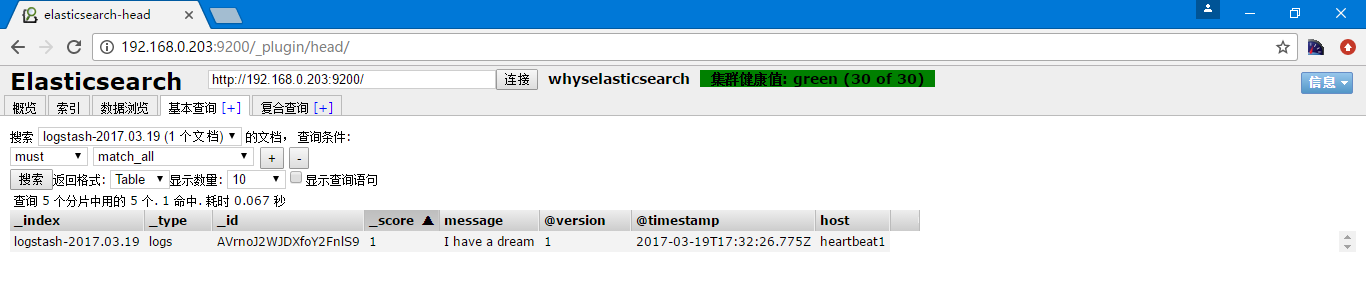
这个索引名称是默认的,当然也可以指定创建
^CSIGINT received. Shutting down the pipeline. {:level=>:warn}
^CSIGINT received. Terminating immediately.. {:level=>:fatal}
logstash官方文档
https://www.elastic.co/guide/en/logstash/current/index.html选择1.5就是对应的官方文档https://www.elastic.co/guide/en/logstash/1.5/index.html
在https://www.elastic.co/guide/en/logstash/1.5/config-examples.html中
通过配置文件启动
input { stdin { } }

filter {
  grok {
    match => { "message" => "%{COMBINEDAPACHELOG}" }
  }
  date {
    match => [ "timestamp" , "dd/MMM/yyyy:HH:mm:ss Z" ]
  }
}

output {
  elasticsearch { host => localhost }
  stdout { codec => rubydebug }
}
通过-f参数指定配置文件
bin/logstash -f logstash-filter.conf
多个输出
并且支持多个输入,多个输出,例如
input {
    file {
        path => "/var/log/messages"
        type => "syslog"
    }
    file {
        path => "/var/log/nginx/access.log"
        type => "nginx"
    }
}
也可以是
input {
    file {
        path => ["/var/log/messages","/var/log/nginx/*.log"]
    }
}
并且支持通配符
输入端支持
https://www.elastic.co/guide/en/logstash/1.5/input-plugins.html
最简单也是最常用的为文件方式 https://www.elastic.co/guide/en/logstash/1.5/plugins-inputs-file.html 格式为 file { path => ... } 注意的是,不支持递归查询,所以如果需要就要写//*的方式,当然还有些可选配置项
- add_field,在日志记录的文件行内添加字段
- exclude,排除某一文件
- sincedb_path,sincedb会记录读取文件的偏移量,如果不设置就是一个隐藏文件
- sincedb_write_interval,写入sincedb的时间间隔,默认为15s
- start_position,读取的位置,默认是end,从最后开始读,如果需要从开头读为beginning
- stat_interval,检测文件更新的时间间隔,默认为1s 更多的可以参考官方文档
输出端支持
https://www.elastic.co/guide/en/logstash/1.5/output-plugins.html
最简单也是最常用的为文件方式 https://www.elastic.co/guide/en/logstash/1.5/plugins-outputs-file.html 格式为 file { path => ... } 其他配置项 - gzip,默认为false不进行压缩,可以通过设置为true进行压缩
配置文件到文件
[root@heartbeat1 ~]# vi /etc/logstash.conf
input {

        file {
                path => "/var/log/messages"
        }

}
output {

        file {
                path => "/opt/%{+YYYY-MM-dd}/messages.gz"
                gzip => true
        }

}
配置文件的检查
[root@heartbeat1 ~]# /usr/local/logstash/bin/logstash  --configtest -f /etc/logstash.conf
Unknown setting 'date_type' for redis {:level=>:error}
Error: Something is wrong with your configuration.
[root@heartbeat1 ~]# /usr/local/logstash/bin/logstash -f /etc/logstash.conf -t
Configuration OK
启动服务
[root@heartbeat1 ~]# /usr/local/logstash/bin/logstash -f /etc/logstash.conf
Logstash startup completed
写入日志
另一终端写入日志
[root@heartbeat1 ~]# echo a >> /var/log/messages
[root@heartbeat1 ~]# echo b >> /var/log/messages
[root@heartbeat1 ~]# echo c >> /var/log/messages
[root@heartbeat1 ~]# ll /opt/2017-03-21/messages.gz
-rw-r--r-- 1 root root 118 Mar 22 00:00 /opt/2017-03-21/messages.gz
配置文件到Elasticsearch
https://www.elastic.co/guide/en/logstash/1.5/plugins-outputs-elasticsearch.html - index,索引,默认为"logstash-%{+YYYY.MM.dd}"
input {

        file {
                path => "/var/log/messages"
        }

}
output {

        file {
                path => "/opt/%{+YYYY-MM-dd}/messages.gz"
                gzip => true
        }

        elasticsearch {
                host => "192.168.0.203"
                protocol => "http"
        }

}
[root@heartbeat1 ~]# /usr/local/logstash/bin/logstash -f /etc/logstash.conf
'[DEPRECATED] use `require 'concurrent'` instead of `require 'concurrent_ruby'`
Logstash startup completed
[root@heartbeat1 opt]# echo d >> /var/log/messages
[root@heartbeat1 opt]# echo c >> /var/log/messages
[root@heartbeat1 opt]# echo b >> /var/log/messages
[root@heartbeat1 opt]# echo a >> /var/log/messages
[root@heartbeat1 opt]# echo e >> /var/log/messages
其实我添加数据的时间是2017年3月22日0:40分
[root@heartbeat1 opt]# ll
total 4
drwxr-xr-x 2 root root 4096 Mar 22 00:02 2017-03-21
[root@heartbeat1 opt]# date
Wed Mar 22 00:50:15 CST 2017
通过redis解耦
即通过file统一写入到redis,然后再从redis中读取写入到Elasticsearch
https://www.elastic.co/guide/en/logstash/1.5/plugins-outputs-redis.html
- date_type,可选list和channel
- db,写入的数据库,默认为0
- host,redis的ip,默认为127.0.0.1
- port,redis的端口,默认为6379
- password,redis的验证
- key,指定redis的key
- reconnect_interval,重试间隔,默认为1s
- timeout,超时时间,默认为5s
- workers,线程数,默认为1个
配置文件到Redis
[root@heartbeat1 ~]# vi /etc/logstash.conf
input {

        file {
                path => "/var/log/messages"
        }

}
output {

        redis {
                data_type => "list"
                key => "systemmessages"
                host => "192.168.0.130"
                port => "6379"
                db => "1"
        }

}
启动Redis
[root@heartbeat2 ~]# yum install -y redis
[root@heartbeat2 ~]# vi /etc/redis.conf
bind 192.168.0.130
[root@heartbeat2 ~]# service redis start
启动 :                                                    [确定]
写入日志
[root@heartbeat1 opt]# echo a >> /var/log/messages
[root@heartbeat1 opt]# echo b >> /var/log/messages
[root@heartbeat1 opt]# echo c >> /var/log/messages
[root@heartbeat1 opt]# echo d >> /var/log/messages
[root@heartbeat1 opt]# echo e >> /var/log/messages
Redis端查询
[root@heartbeat2 ~]# redis-cli -h 192.168.0.130
redis 192.168.0.130:6379> select 1
OK
redis 192.168.0.130:6379[1]> LLEN systemmessages
(integer) 5
redis 192.168.0.130:6379[1]> LINDEX systemmessages -1
"{\"message\":\"e\",\"@version\":\"1\",\"@timestamp\":\"2017-03-21T17:33:29.591Z\",\"host\":\"heartbeat1\",\"path\":\"/var/log/messages\"}"
可以看到数据已经写入
在Redis主机上添加logstash
[root@heartbeat2 ~]# java -version
java version "1.8.0_73"
Java(TM) SE Runtime Environment (build 1.8.0_73-b02)
Java HotSpot(TM) 64-Bit Server VM (build 25.73-b02, mixed mode)
[root@heartbeat2 ~]# tar xf logstash-1.5.3.tar.gz
[root@heartbeat2 ~]# mv logstash-1.5.3 /usr/local/logstash
配置Redis到Elastsearch
https://www.elastic.co/guide/en/logstash/1.5/plugins-inputs-redis.html
[root@heartbeat2 ~]# vi /etc/logstash.conf
input {

        redis {
                data_type => "list"
                key => "systemmessages"
                host => "192.168.0.130"
                port => "6379"
                db => "1"
        }

}
output {

        elasticsearch {
                host => "192.168.0.203"
                protocol => "http"
                index => "systemmessage-%{+YYYY.MM.dd}"
        }

}
启动服务
[root@heartbeat2 ~]# /usr/local/logstash/bin/logstash -f /etc/logstash.conf
'[DEPRECATED] use require 'concurrent' instead of require 'concurrent_ruby'
Logstash startup completed
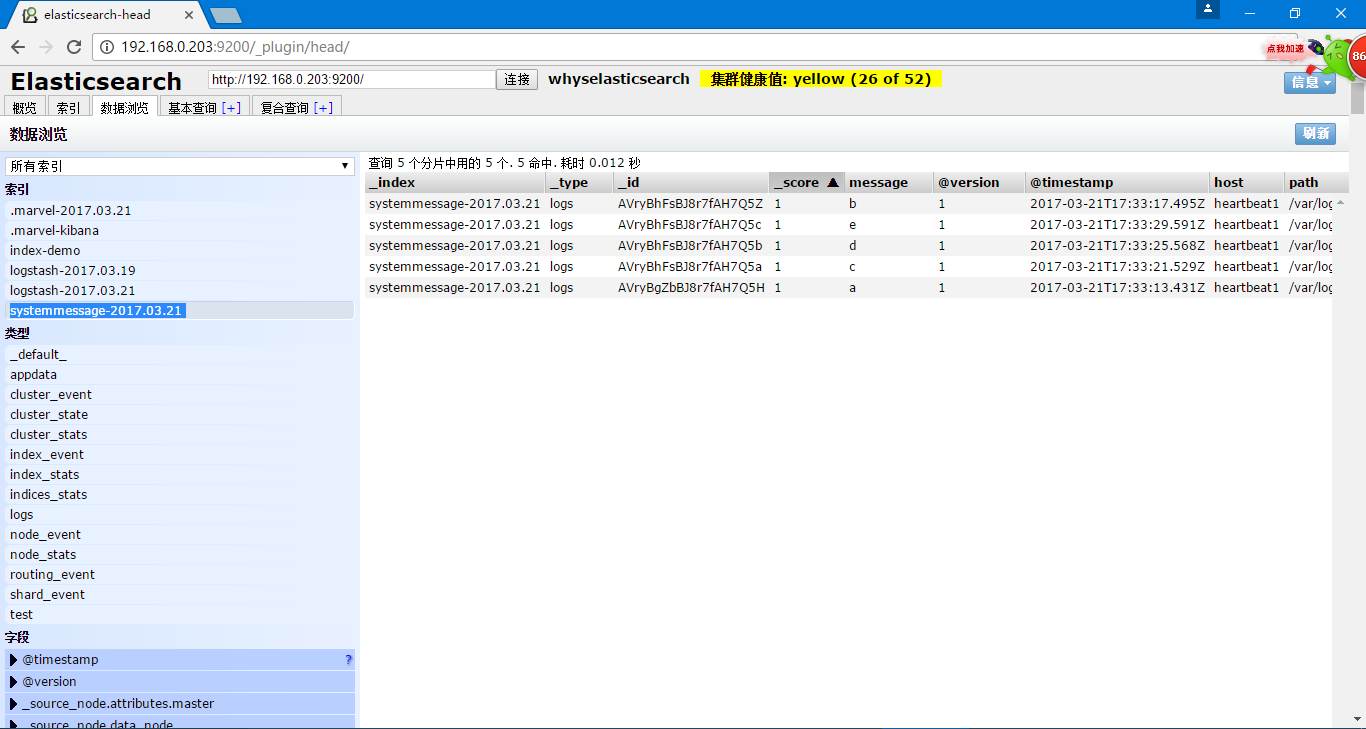
查询结果
此时通过redis查看的时候回发现信息已经被取走
[root@heartbeat2 ~]# redis-cli -h 192.168.0.130
redis 192.168.0.130:6379> select 1
OK
redis 192.168.0.130:6379[1]> LLEN systemmessages
(integer) 0
在head中也可以查看到对应的数据
通过json进行日志存储
日志收集的要求
需要收集的日志,系统日志,访问日志,错误日志,运行日志,其他日志
例如ngixn的访问日志,查询502错误的,url中有502的也被搜索出来了,并非我想要的结果
这种方式可以通过像filters中定义grok和在codec中定义json日志
grok自带一些写好的正则表达式,也支持自定义的正则表达式,不过这样的问题就是在每条消息都进行处理,就会导致在大数据量的时候cpu飙升,本来是用来处理业务的主机变成了日志收集的主机,所以生产环境并不推荐使用此功能。
配置Nginx日志格式
[root@heartbeat1 ~]# cd /usr/local/nginx/conf/
[root@heartbeat1 conf]# vi nginx.conf
http标签中日志格式
    log_format logstash_json '{"@timestamp":"$time_iso8601",'
           '"host":"$server_addr",'
           '"client":"$remote_addr",'
           '"size":"$body_bytes_sent",'
           '"responsetime":"$request_time",'
           '"domain":"$host",'
           '"url":"$uri",'
           '"referer":"$http_referer",'
           '"agent":"$http_user_agent",'
           '"status":"$status"}';
server中使用对应日志格式
        access_log  logs/json.access.log  logstash_json;
启动nginx服务,可以看一下我们的日志格式
[root@heartbeat1 conf]# ../sbin/nginx
[root@heartbeat1 conf]# ss -nlput | grep 80
tcp    LISTEN     0      128                    *:80                    *:*      users:(("nginx",5728,6),("nginx",5729,6))
[root@heartbeat1 conf]# curl 192.168.0.203
192.168.0.203
[root@heartbeat1 conf]# curl 192.168.0.203
192.168.0.203
[root@heartbeat1 conf]# curl 192.168.0.203
192.168.0.203
[root@heartbeat1 conf]# cat ../logs/json.access.log
{"@timestamp":"2017-03-22T23:50:20+08:00","host":"192.168.0.203","client":"192.168.0.203","size":"14","responsetime":"0.000","domain":"192.168.0.203","url":"/index.html","referer":"-","agent":"curl/7.19.7 (x86_64-redhat-linux-gnu) libcurl/7.19.7 NSS/3.14.3.0 zlib/1.2.3 libidn/1.18 libssh2/1.4.2","status":"200"}
{"@timestamp":"2017-03-22T23:50:21+08:00","host":"192.168.0.203","client":"192.168.0.203","size":"14","responsetime":"0.000","domain":"192.168.0.203","url":"/index.html","referer":"-","agent":"curl/7.19.7 (x86_64-redhat-linux-gnu) libcurl/7.19.7 NSS/3.14.3.0 zlib/1.2.3 libidn/1.18 libssh2/1.4.2","status":"200"}
{"@timestamp":"2017-03-22T23:50:21+08:00","host":"192.168.0.203","client":"192.168.0.203","size":"14","responsetime":"0.000","domain":"192.168.0.203","url":"/index.html","referer":"-","agent":"curl/7.19.7 (x86_64-redhat-linux-gnu) libcurl/7.19.7 NSS/3.14.3.0 zlib/1.2.3 libidn/1.18 libssh2/1.4.2","status":"200"}
配置logstash
[root@heartbeat1 conf]# vi /etc/logstash.conf
input {

        file {
                path => "/usr/local/nginx/logs/json.access.log"
                codec => "json"
        }

}
output {

        redis {
                data_type => "list"
                key => "nginx"
                host => "192.168.0.130"
                port => "6379"
                db => "2"
        }

}
启动Elasticsearch
[root@heartbeat1 conf]# /usr/local/logstash/bin/logstash -f /etc/logstash.conf
Logstash startup completed
通过ab写入数据
如果没有ab命令,yum install -y httpd-devel
[root@heartbeat1 conf]# ab -n1000 -c10 http://192.168.0.203/
This is ApacheBench, Version 2.3 <$Revision: 655654 $>
Copyright 1996 Adam Twiss, Zeus Technology Ltd, http://www.zeustech.net/
Licensed to The Apache Software Foundation, http://www.apache.org/

Benchmarking 192.168.0.203 (be patient)
Completed 100 requests
Completed 200 requests
Completed 300 requests
Completed 400 requests
Completed 500 requests
Completed 600 requests
Completed 700 requests
Completed 800 requests
Completed 900 requests
Completed 1000 requests
Finished 1000 requests


Server Software:        nginx/1.6.3
Server Hostname:        192.168.0.203
Server Port:            80

Document Path:          /
Document Length:        14 bytes

Concurrency Level:      10
Time taken for tests:   0.231 seconds
Complete requests:      1000
Failed requests:        0
Write errors:           0
Total transferred:      243000 bytes
HTML transferred:       14000 bytes
Requests per second:    4321.60 [#/sec] (mean)
Time per request:       2.314 [ms] (mean)
Time per request:       0.231 [ms] (mean, across all concurrent requests)
Transfer rate:          1025.53 [Kbytes/sec] received

Connection Times (ms)
              min  mean[+/-sd] median   max
Connect:        0    0   4.2      0      51
Processing:     0    2   2.3      1      51
Waiting:        0    1   1.7      1      14
Total:          0    2   4.7      1      51

Percentage of the requests served within a certain time (ms)
  50%      1
  66%      2
  75%      2
  80%      2
  90%      3
  95%      5
  98%      9
  99%     14
 100%     51 (longest request)
[root@heartbeat1 conf]# ll ../logs/json.access.log
-rw-r--r-- 1 root root 226939 Mar 22 23:54 ../logs/json.access.log
[root@heartbeat2 ~]# redis-cli -h 192.168.0.130
redis 192.168.0.130:6379> select 2
OK
redis 192.168.0.130:6379[2]> keys *
1) "nginx"
redis 192.168.0.130:6379[2]> llen nginx
(integer) 1000
redis 192.168.0.130:6379[2]> quit
[root@heartbeat2 ~]# vi /etc/logstash.conf
input {

        redis {
                data_type => "list"
                key => "nginx"
                host => "192.168.0.130"
                port => "6379"
                db => "2"
        }


}
output {

        elasticsearch {
                host => "192.168.0.203"
                protocol => "http"
                index => "nginx-accesslog-%{+YYYY.MM.dd}"
        }

}
[root@heartbeat2 ~]# /usr/local/logstash/bin/logstash -f /etc/logstash.conf
'[DEPRECATED] use `require 'concurrent'` instead of `require 'concurrent_ruby'`
Logstash startup completed
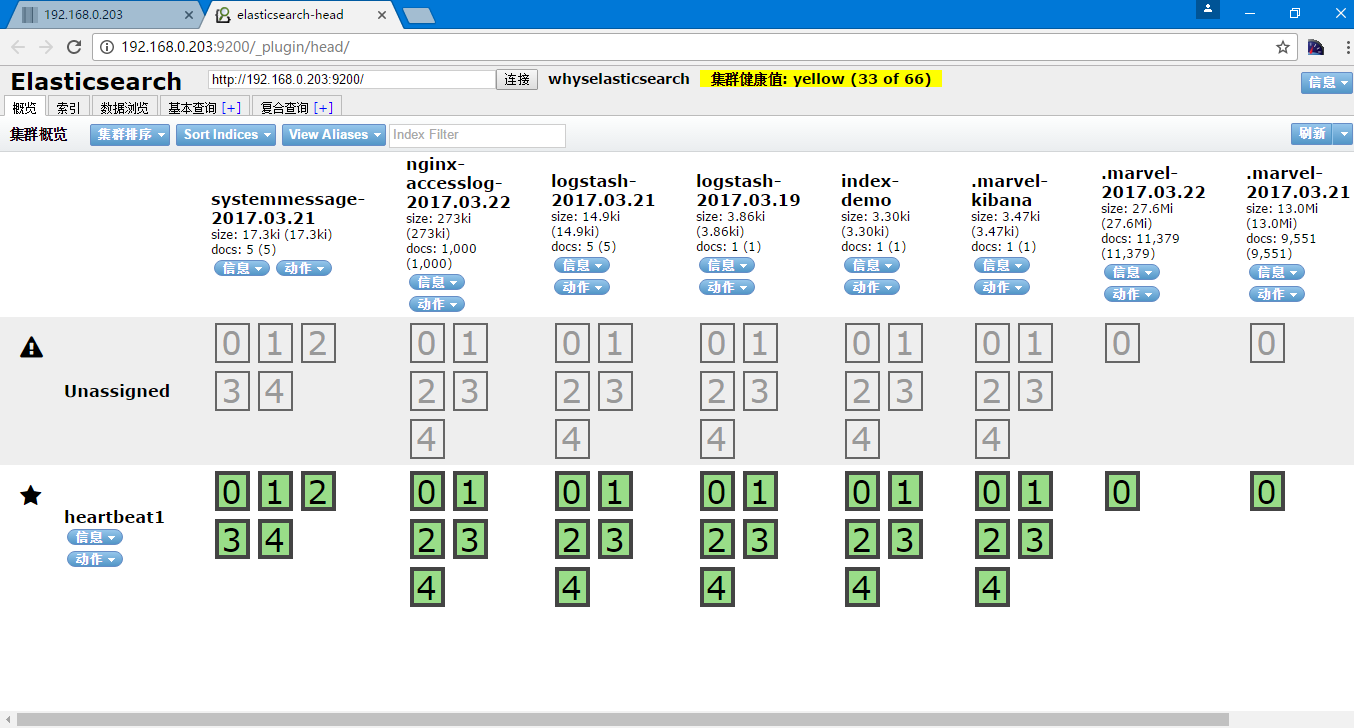
[root@heartbeat2 ~]# redis-cli -h 192.168.0.130
redis 192.168.0.130:6379> select 2
OK
redis 192.168.0.130:6379[2]> llen nginx
(integer) 0
redis 192.168.0.130:6379[2]>
如果json的格式错误,就会在logstash的日志中记录json解析失败,json也有在线的检验网址,http://www.bejson.com/
另外logstash的常用配置
input为syslog收集系统日志,需要配置port514和bind的IP地址,参考https://www.elastic.co/guide/en/logstash/1.5/plugins-inputs-syslog.html
收集多行日志,例如java或Python的报错为多行,可以用codec => multiline pattern => ".*\t.*",参考https://www.elastic.co/guide/en/logstash/1.5/plugins-codecs-multiline.html
geoip,通过ip转换成地址,参考https://www.elastic.co/guide/en/logstash/1.5/plugins-filters-geoip.html
logstash也可以把多个input根据type等进行写入到不同的output中,详细的参考https://www.elastic.co/guide/en/logstash/1.5/event-dependent-configuration.html
kibana
- 主页链接 https://www.elastic.co/guide/en/kibana/4.1/index.html
- 介绍链接 https://www.elastic.co/guide/en/kibana/4.1/introduction.html
安装kibana
[root@heartbeat1 ~]# wget https://download.elastic.co/kibana/kibana/kibana-4.1.1-linux-x64.tar.gz
[root@heartbeat1 ~]# tar xf kibana-4.1.1-linux-x64.tar.gz
[root@heartbeat1 ~]# mv kibana-4.1.1-linux-x64 /usr/local/kibana
[root@heartbeat1 ~]# cd !$/config
cd /usr/local/kibana/config
[root@heartbeat1 config]# vi kibana.yml                 #修改kibana的配置文件中Elasticsearch的地址
elasticsearch_url: "http://192.168.0.203:9200"
[root@heartbeat1 config]# ../bin/kibana                 #启动kinana
{"name":"Kibana","hostname":"heartbeat1","pid":4387,"level":30,"msg":"No existing kibana index found","time":"2017-03-22T09:37:11.843Z","v":0}
{"name":"Kibana","hostname":"heartbeat1","pid":4387,"level":30,"msg":"Listening on 0.0.0.0:5601","time":"2017-03-22T09:37:11.926Z","v":0}
后台启动可以nohup ../bin/kibana &
进入到对应IP的5601端口web页面
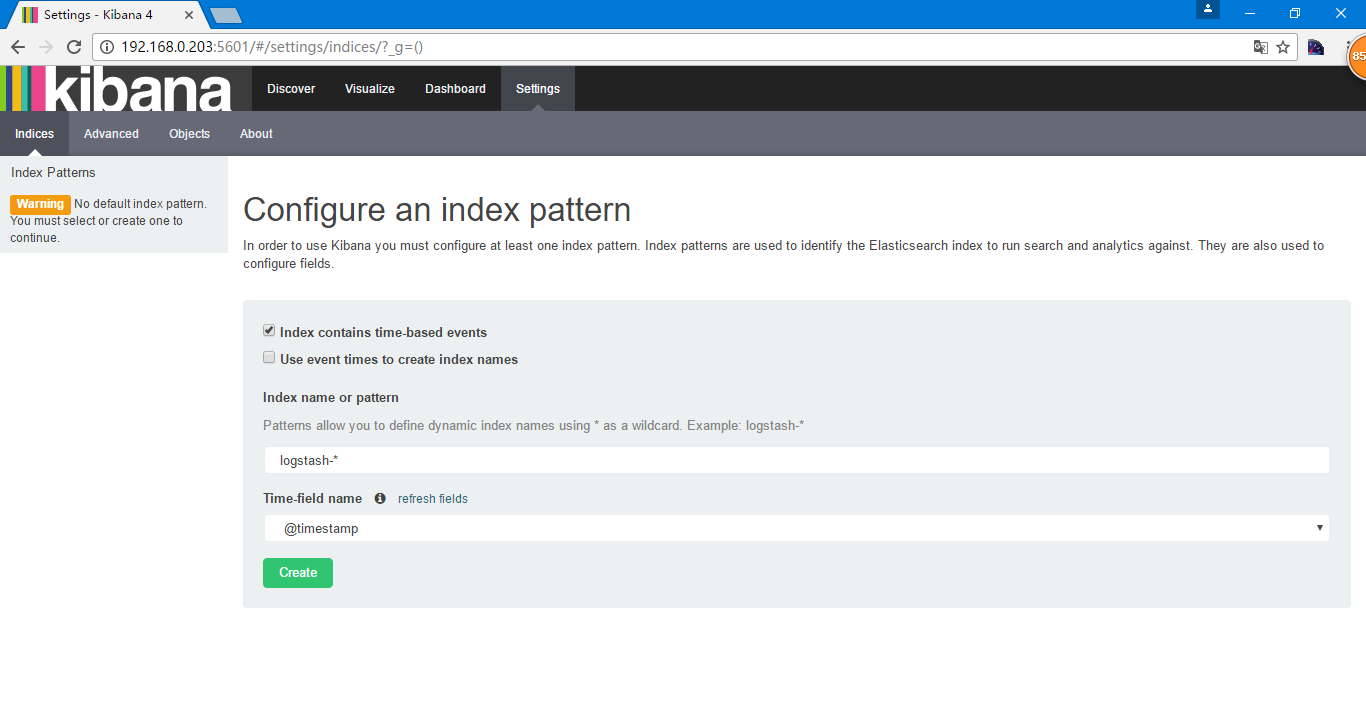
选择Use event times to create index names
Index name or pattern根据当时创建的索引nginx-accesslog-%{+YYYY.MM.dd}的格式,在Elasticsearch中为nginx-accesslog-2017.03.22,在kibana中写成[nginx-accesslog-]YYYY.MM.DD
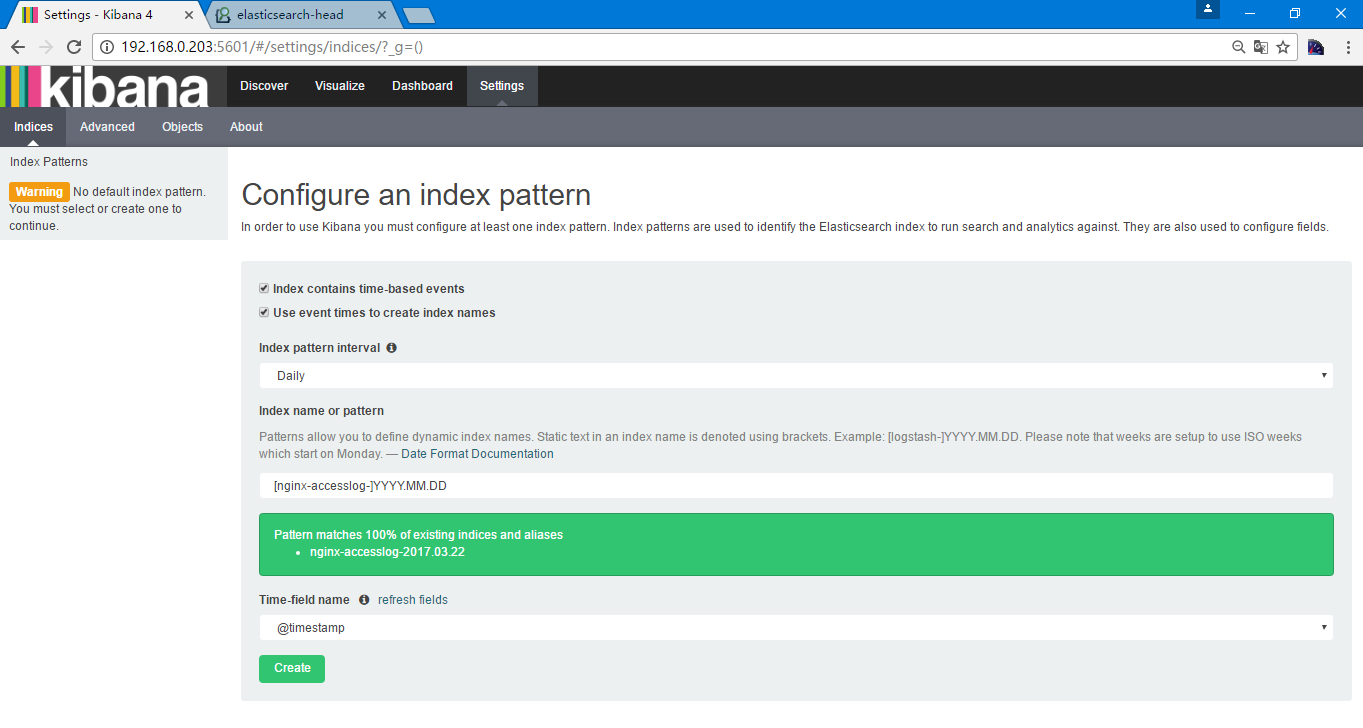
选择创建
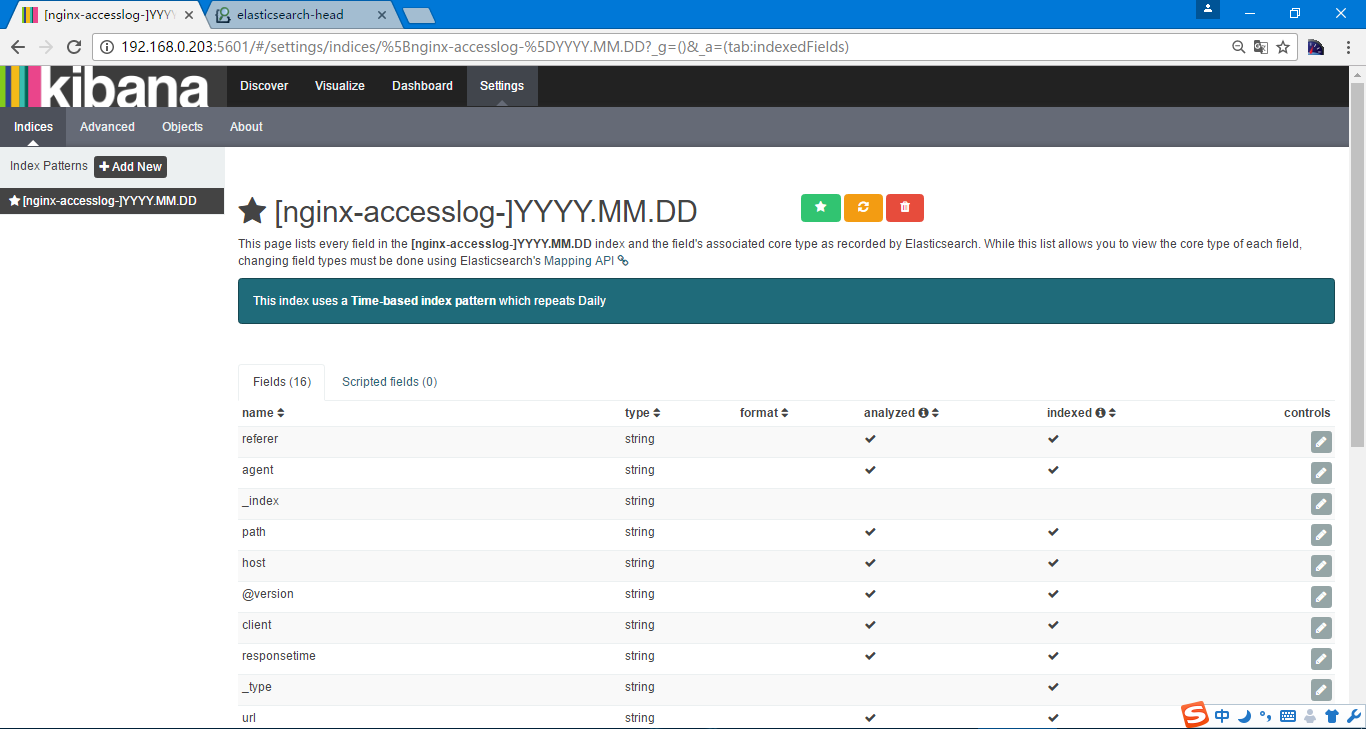
界面中有添加索引的功能,并且默认索引前会有一个五角星
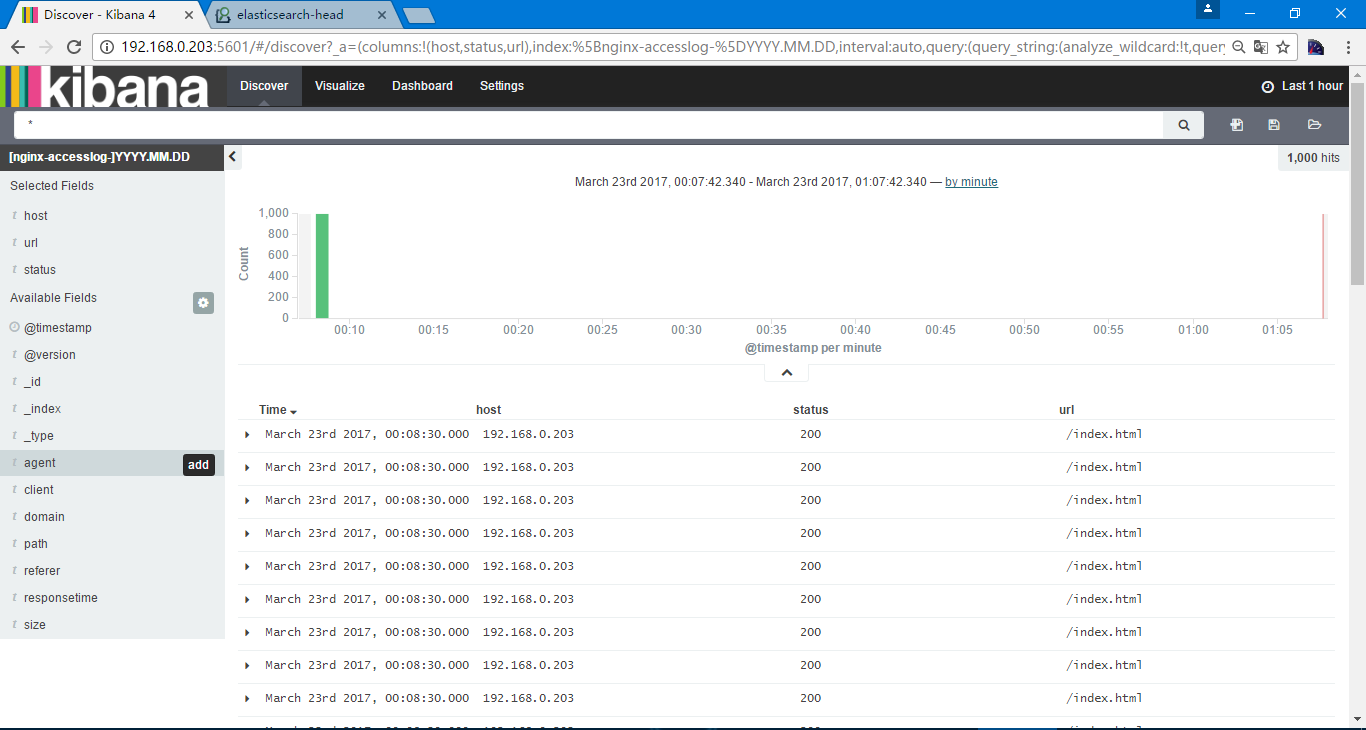
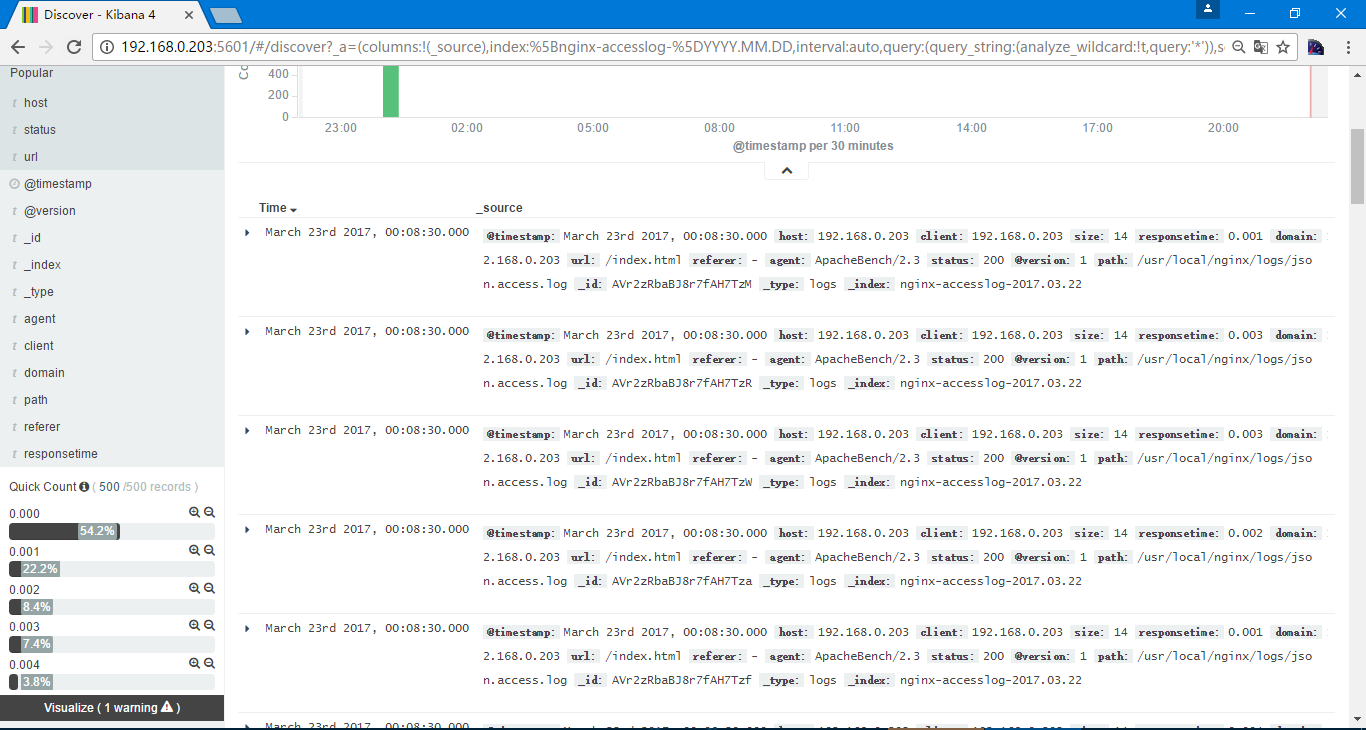
选择discover
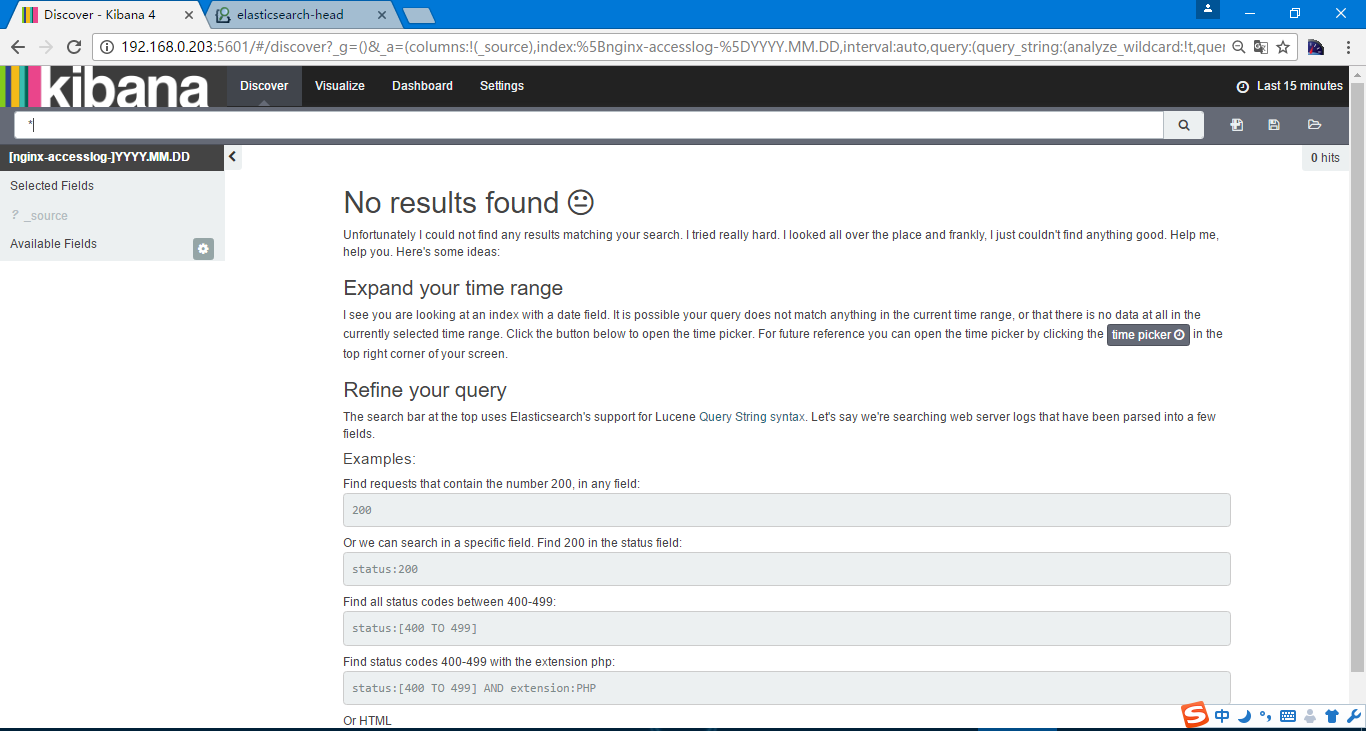
此时看到的为右上角默认的last 15 minutes的信息
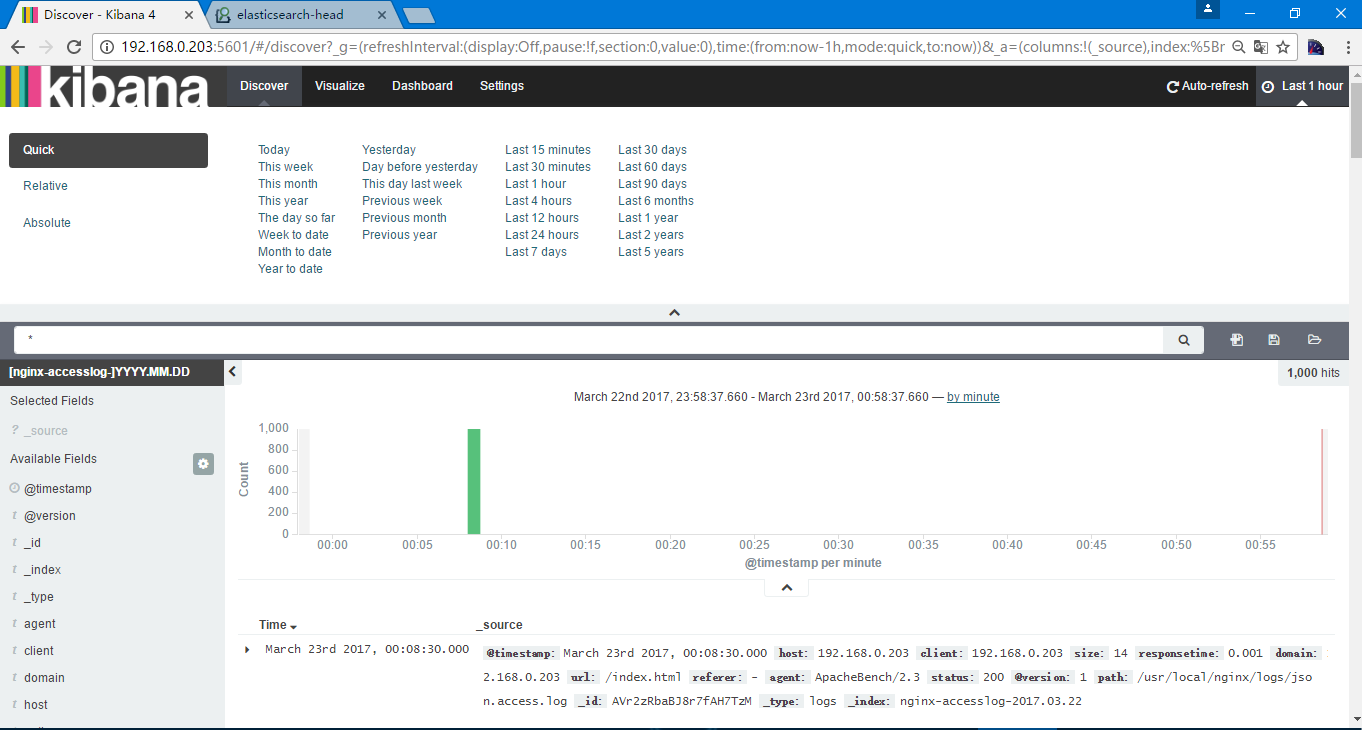
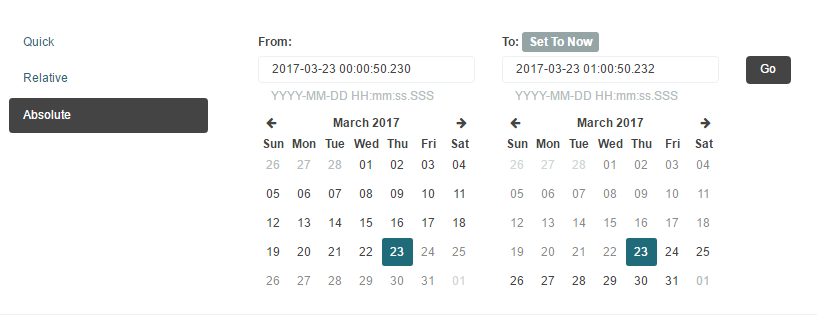
通过点击右上角选择包含添加日志数据的,我选择的Last 1 hour
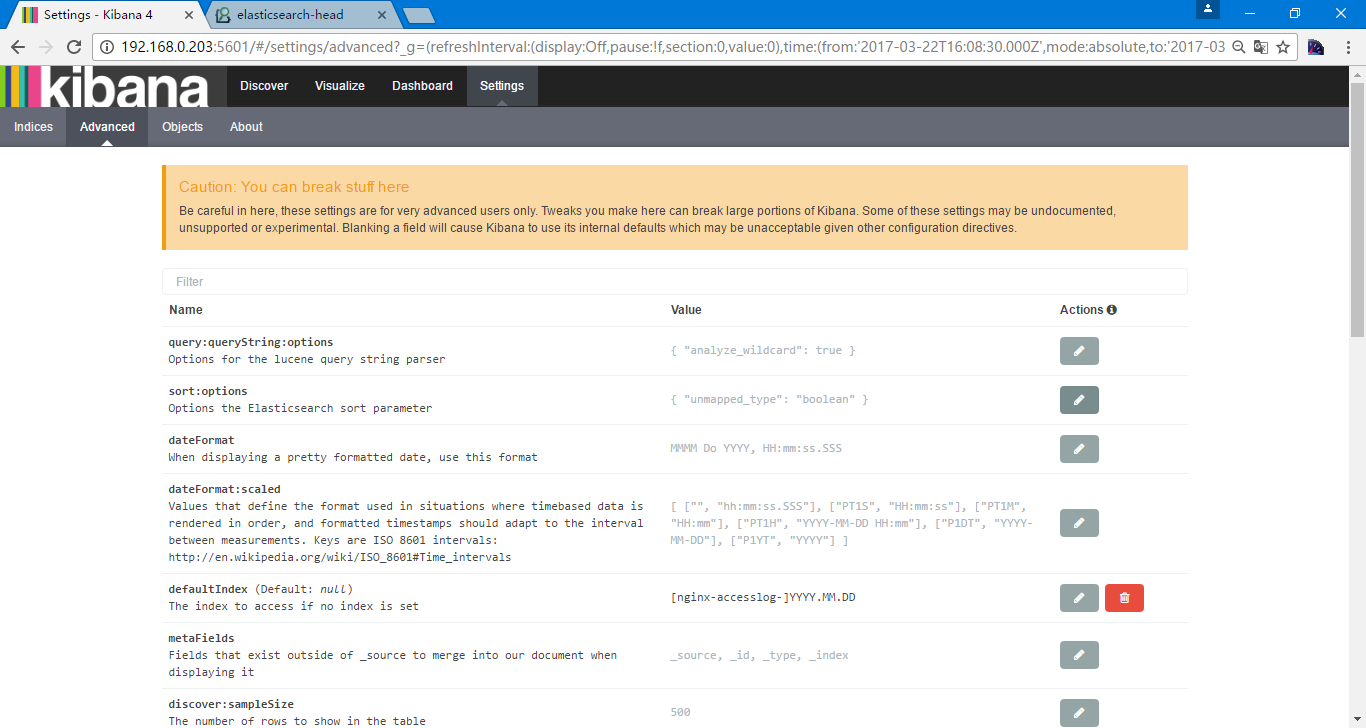
默认是显示500的文档,以倒叙的方式,都可以在setting中设置,选择setting后选择advanced
当然也提供了其他选择时间的方式

此时选择的为全部的信息,可以在左侧选择需要显示的内容
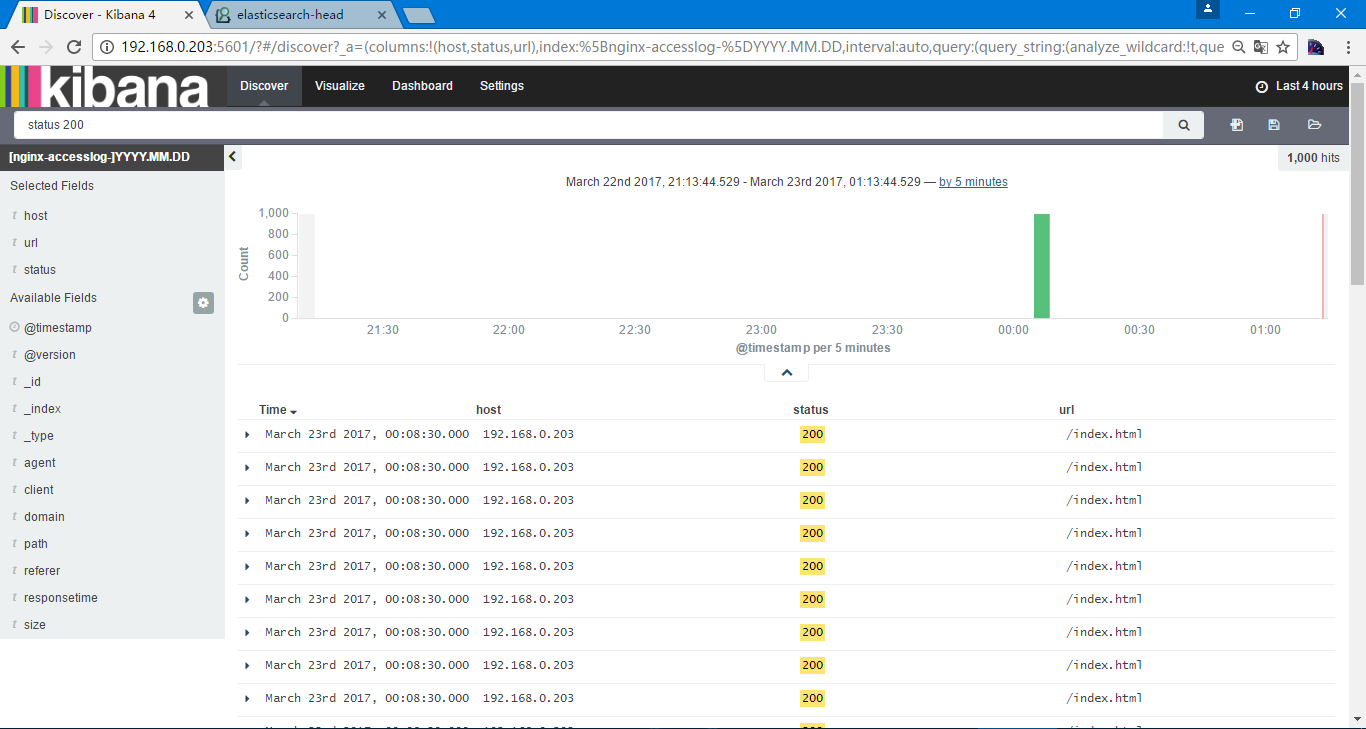
日志搜素,在上边输入status 404
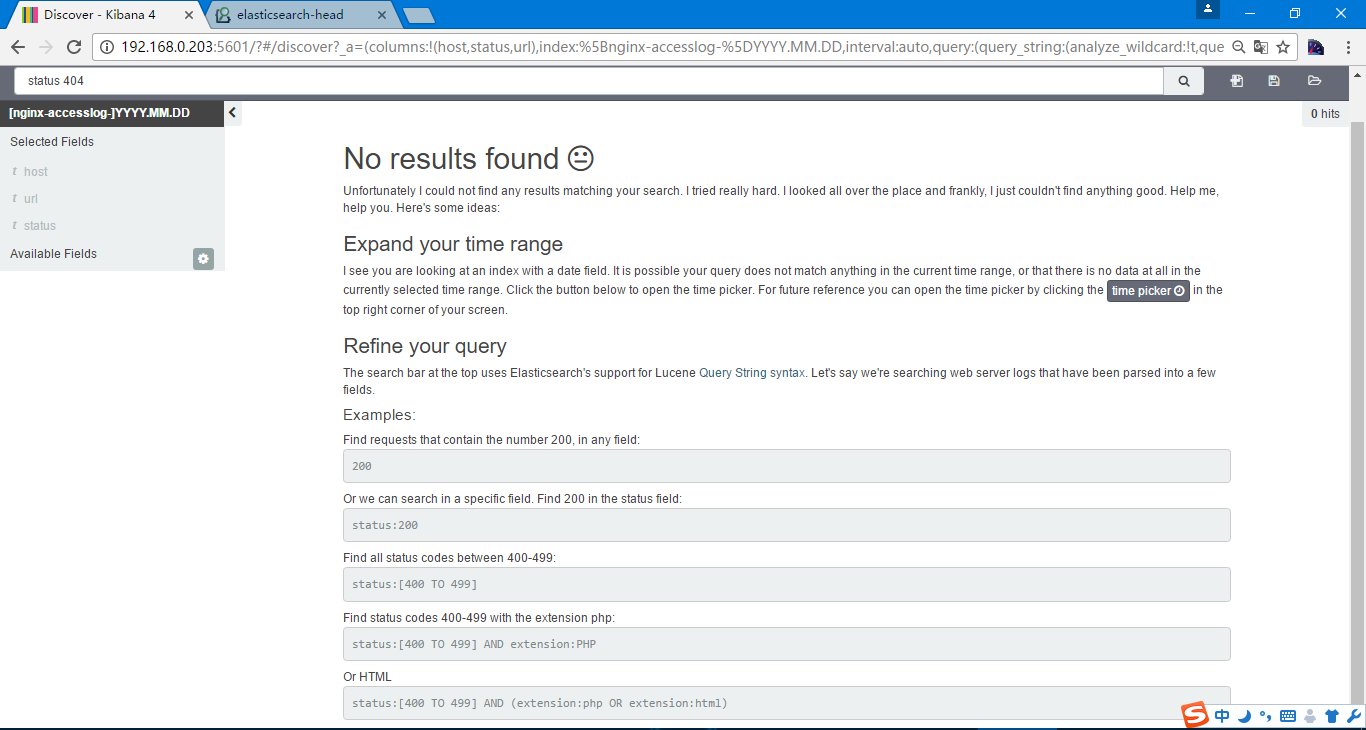
当时我们都是访问成功,不存在404,在此也列出了一些其他的搜索方式,包括
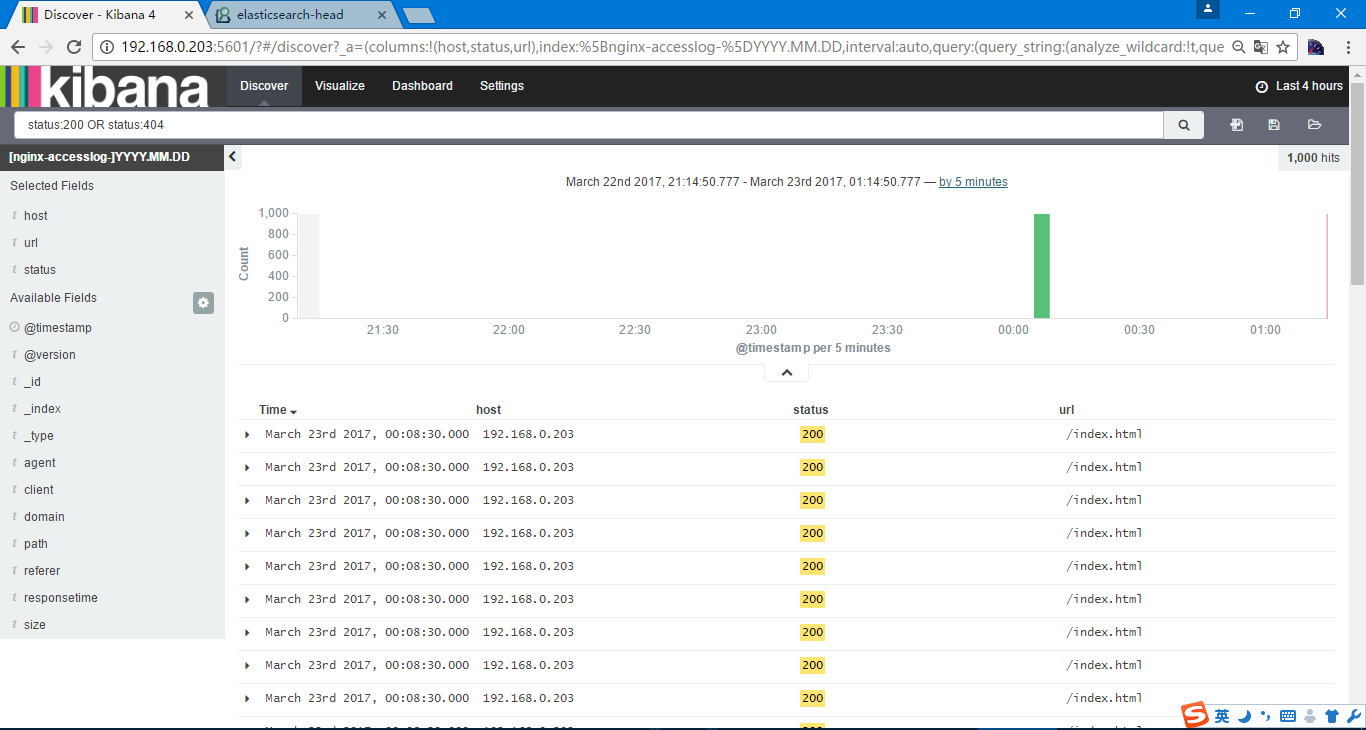
因为日志信息的问题就不再演示了,一般可以是选择status 404 AND url 一个业务url 进行搜索
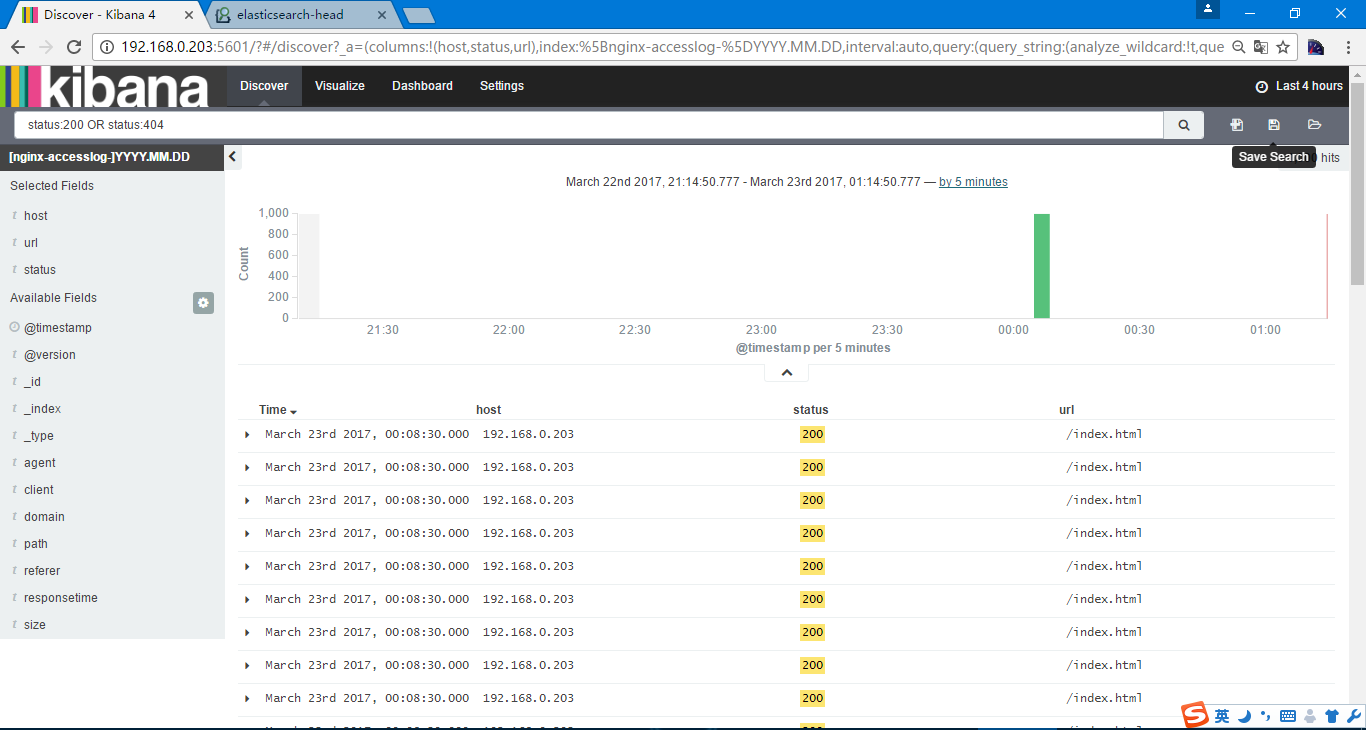
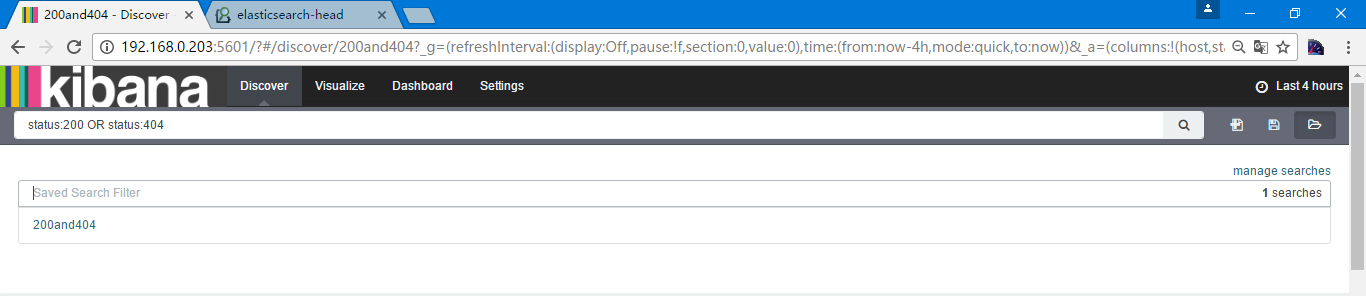
日常的一些搜素可以进行保存
选择save search
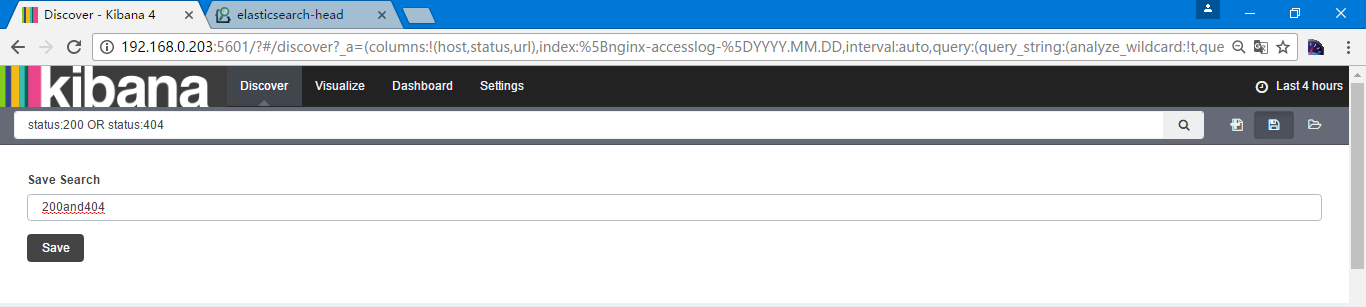
 输入search的名称,点击save即可
 使用保存的搜索选择旁边的Load saved search
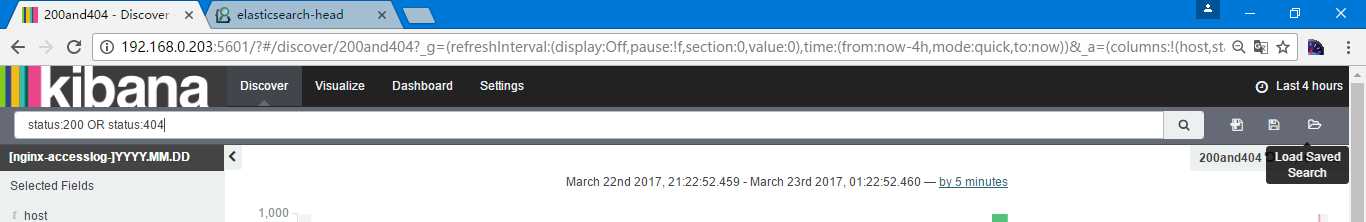 然后就能看到刚才保存的内容
 可以直接选择画图
 得到的图像
选择visualize进行画图
得到的图像
选择visualize进行画图
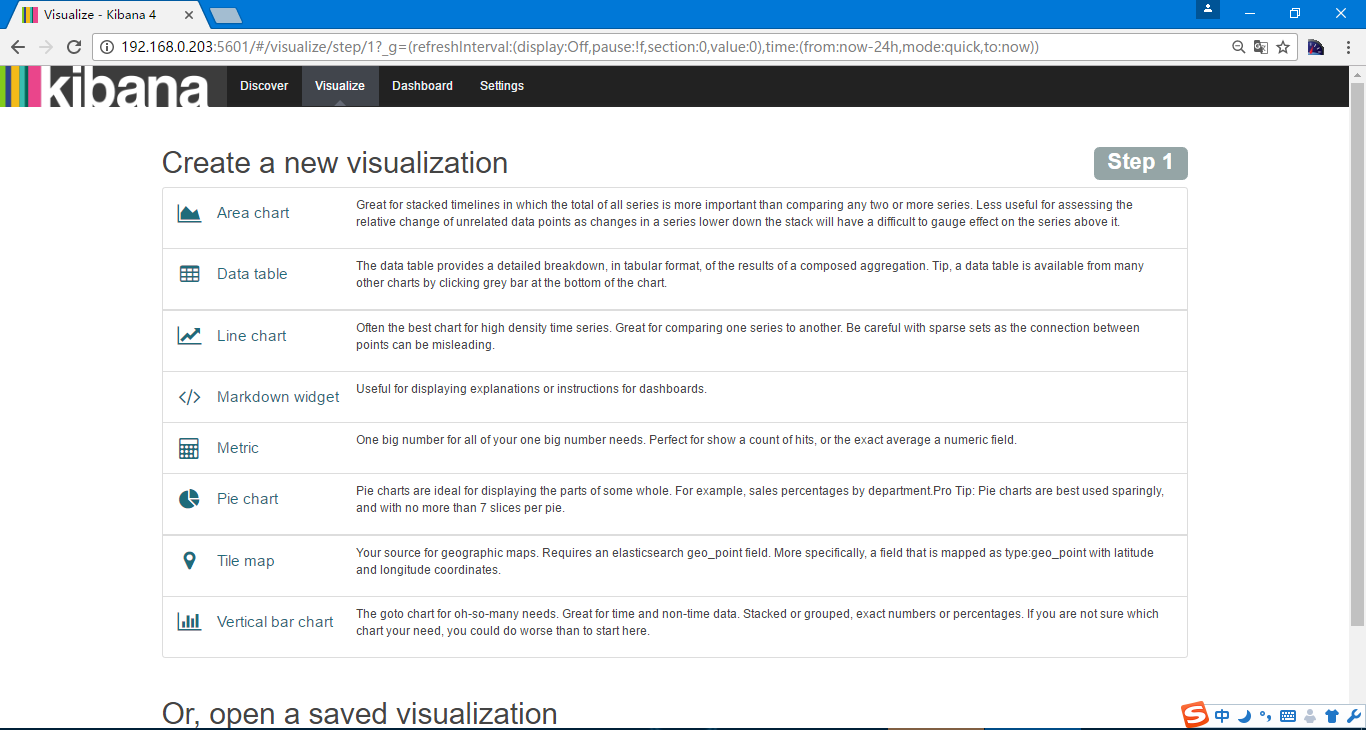 选择饼图
选择饼图
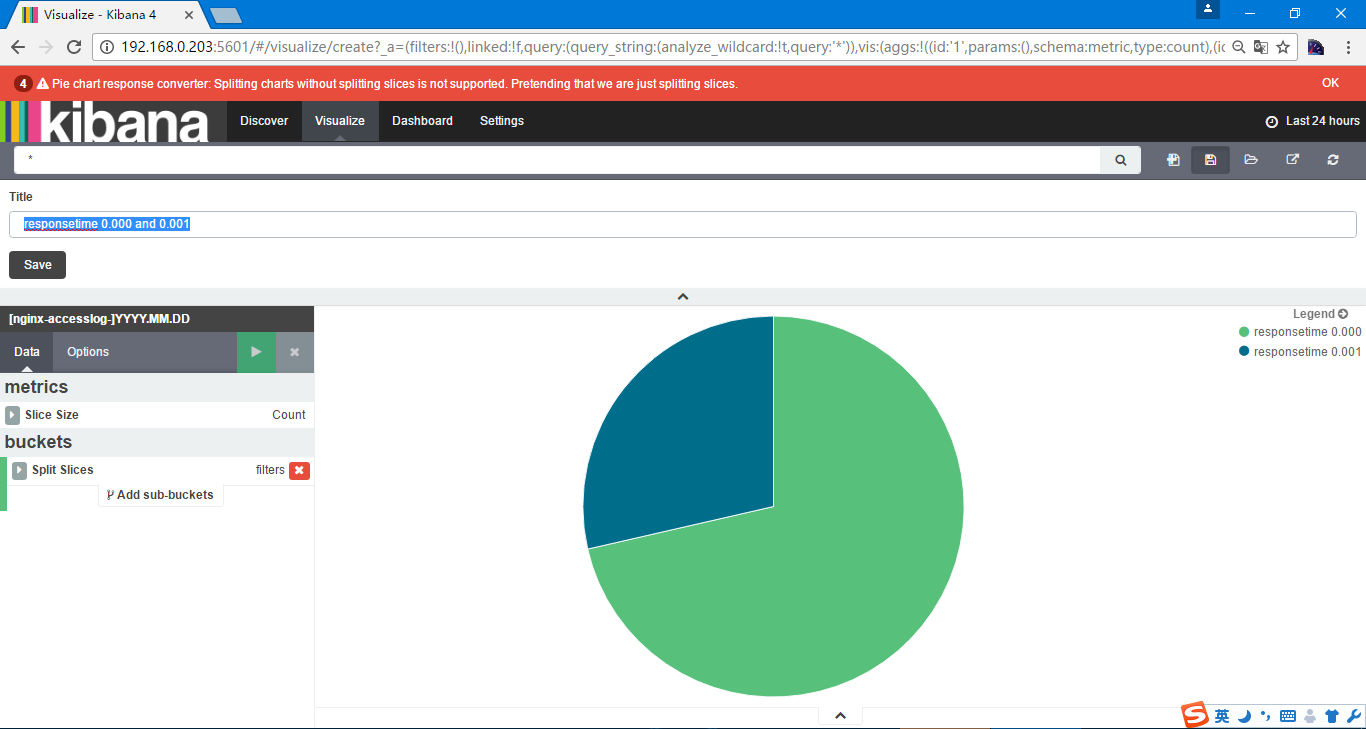
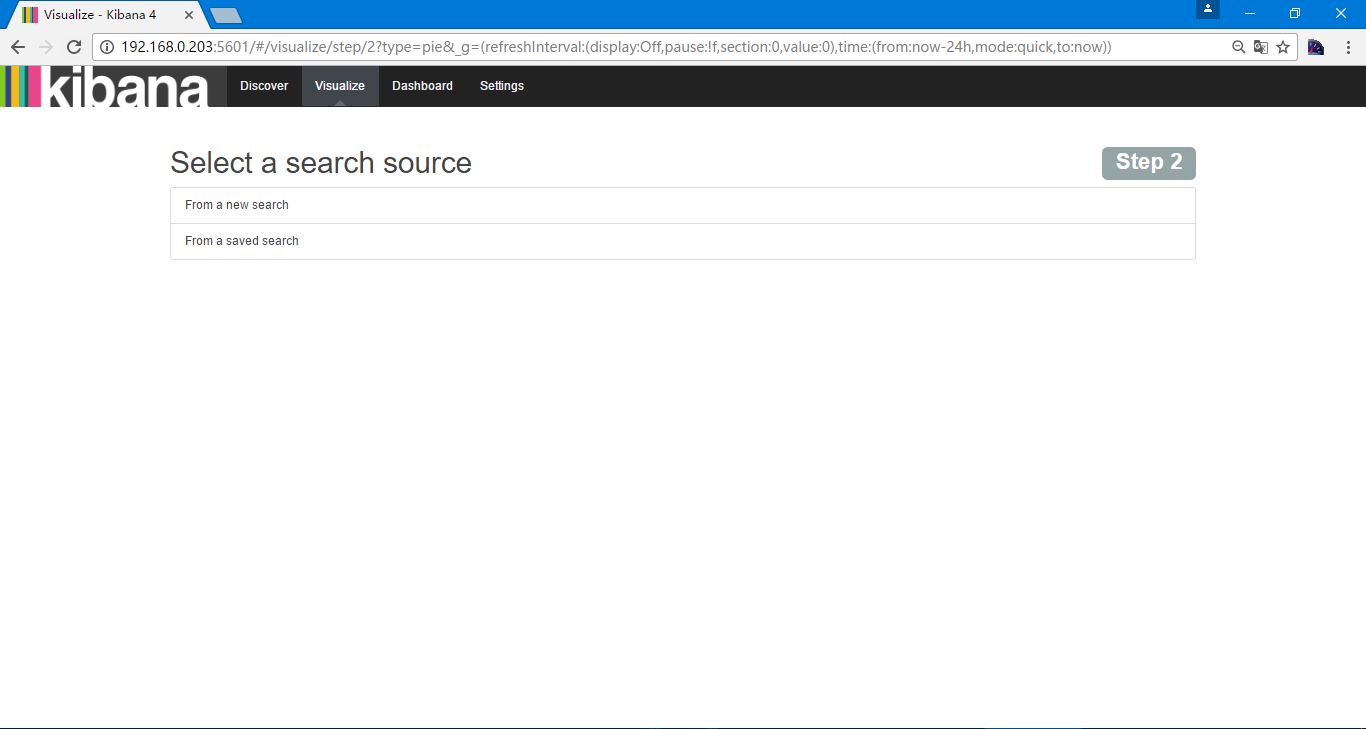 选择,进行饼图展现
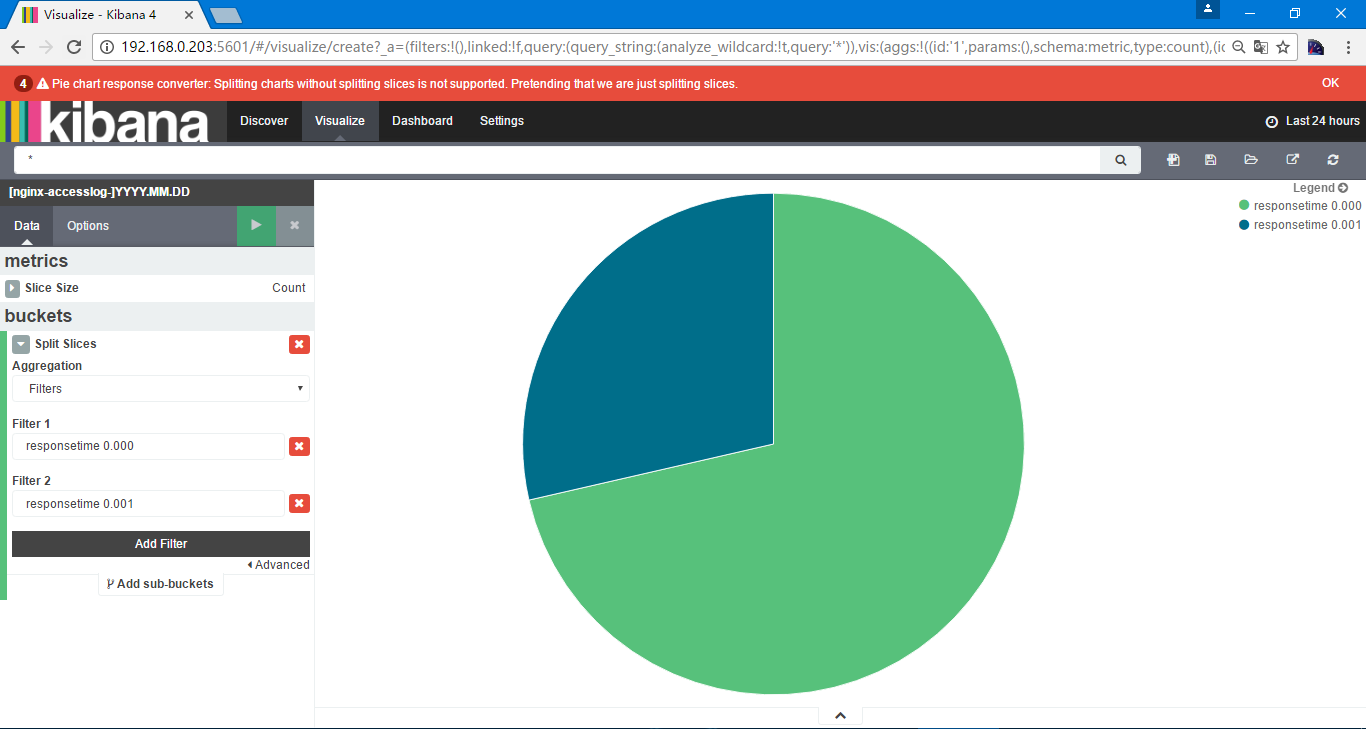
保存名字为responsetime 0.000 and 0.001
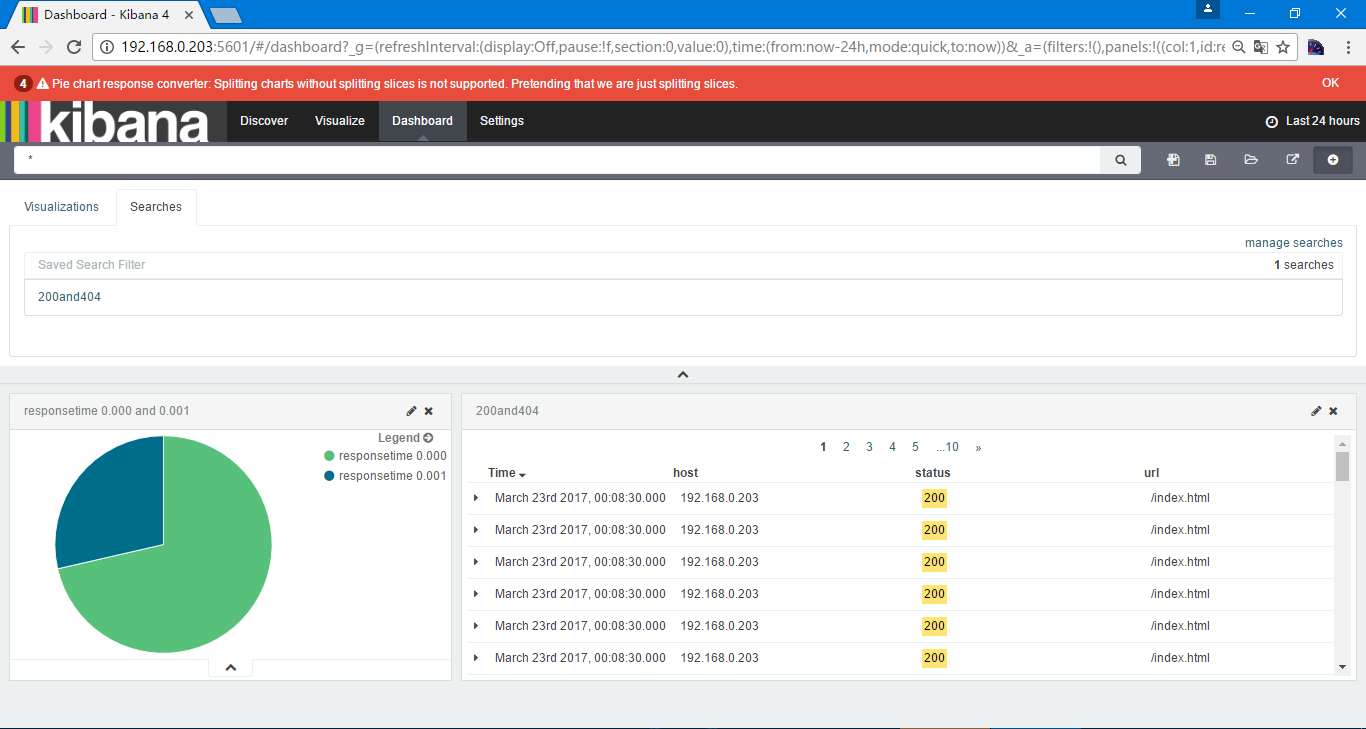
在仪表盘
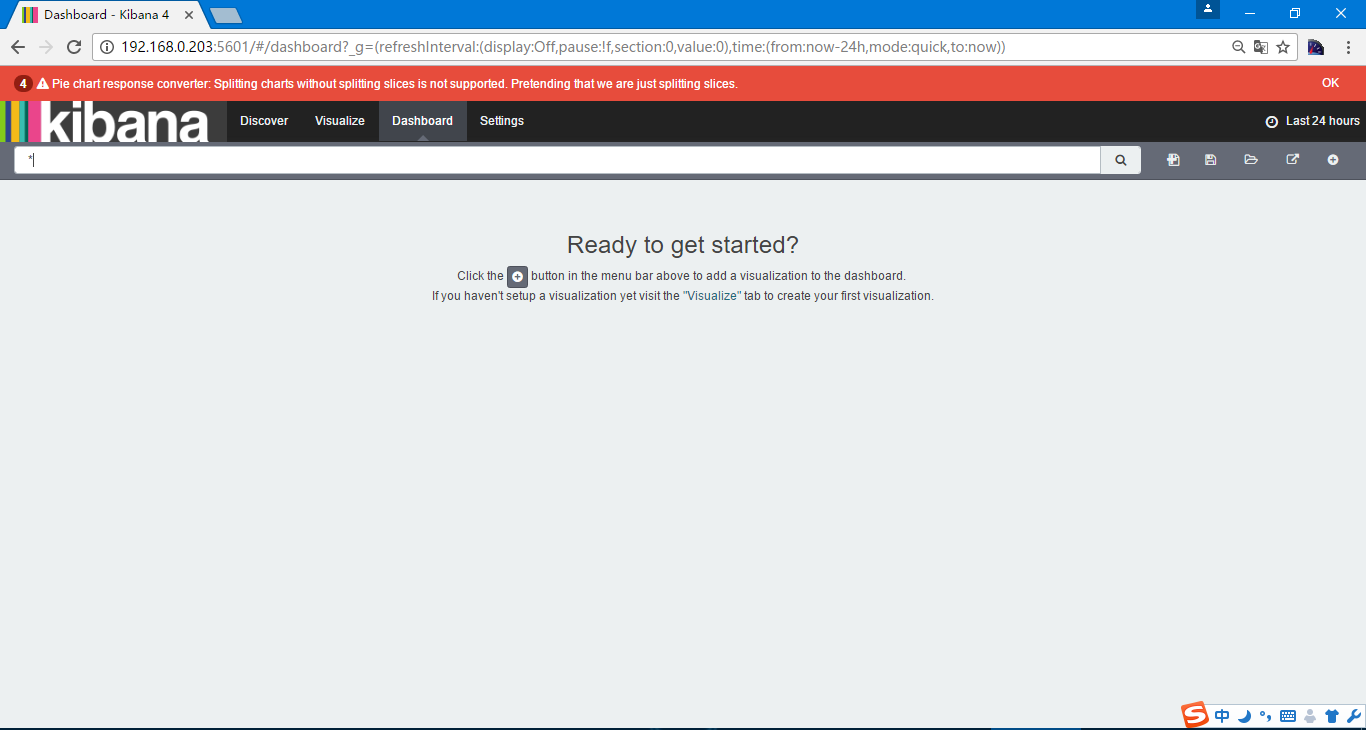 可以选择保存过的vi和search生成仪表盘
更多的可以参考 https://www.gitbook.com/book/chenryn/elk-stack-guide-cn/details
另外ELK有一个问题,Elasticsearch使用的是UTC时间,而kibana是根据浏览器时间显示,也就是自动+8小时,logstash写入ELasticsearch的时候自动转换为UTC时间,所以logstash写入Elasticsearch通过kibana查看是正常的,如果是通过python等写入Elasticsearch,通过kinaba查询就会有一定的时间问题

